Analysis of Tweets sent from Europe on June 2022
This report is a part of assessment of ECMM443.
Brief⌗
The dataset this report uses consists of tweets collected from the Twitter API during the period June 1st to June 30th, 2022. These tweets were collected by applying a geographical filter to return only tweets in Europe. The Europe is represented by the bounding box that the lower-left corner is at (-24.5, 34.8) and the upper-right is at (69.1, 81.9).
1. Basic Stats⌗
1.1 Total number⌗
The total number of tweets is 15027158.
There are some anomalies in the data set like error info. Use zipfile module to unzip all zip files. Use json module to select the ones with valid id_str entries. Then import data to pandas to formalize the datetime in created_at from Coordinated Universal Time(UTC) to British Summer Time(BST). All time mentioned in this report is in BST. Finally, use .drop_duplicates() to remove duplicated entries and save the dataframes to csv files by date.
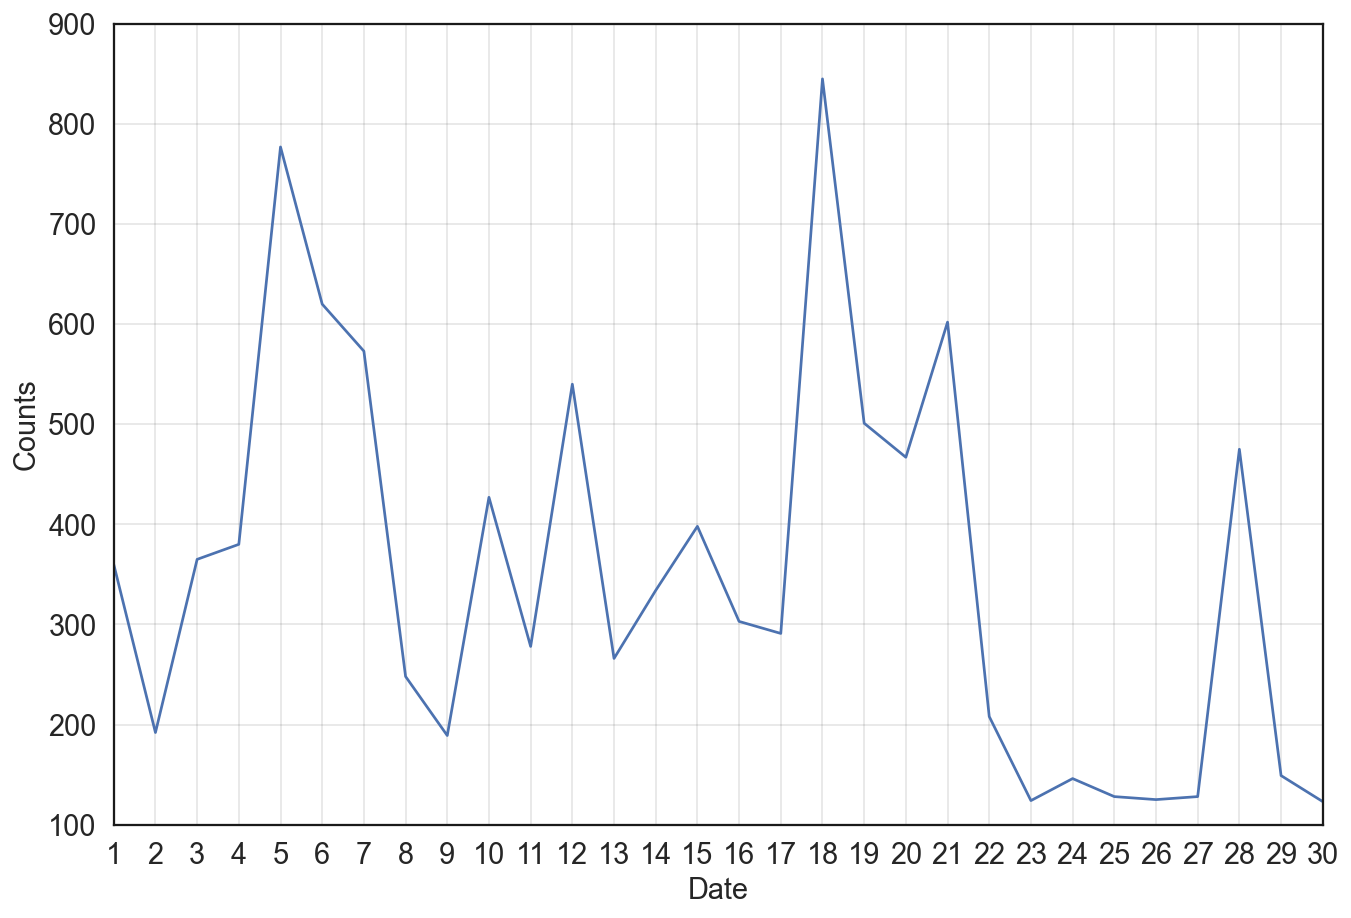
1.2 Tweets by day⌗
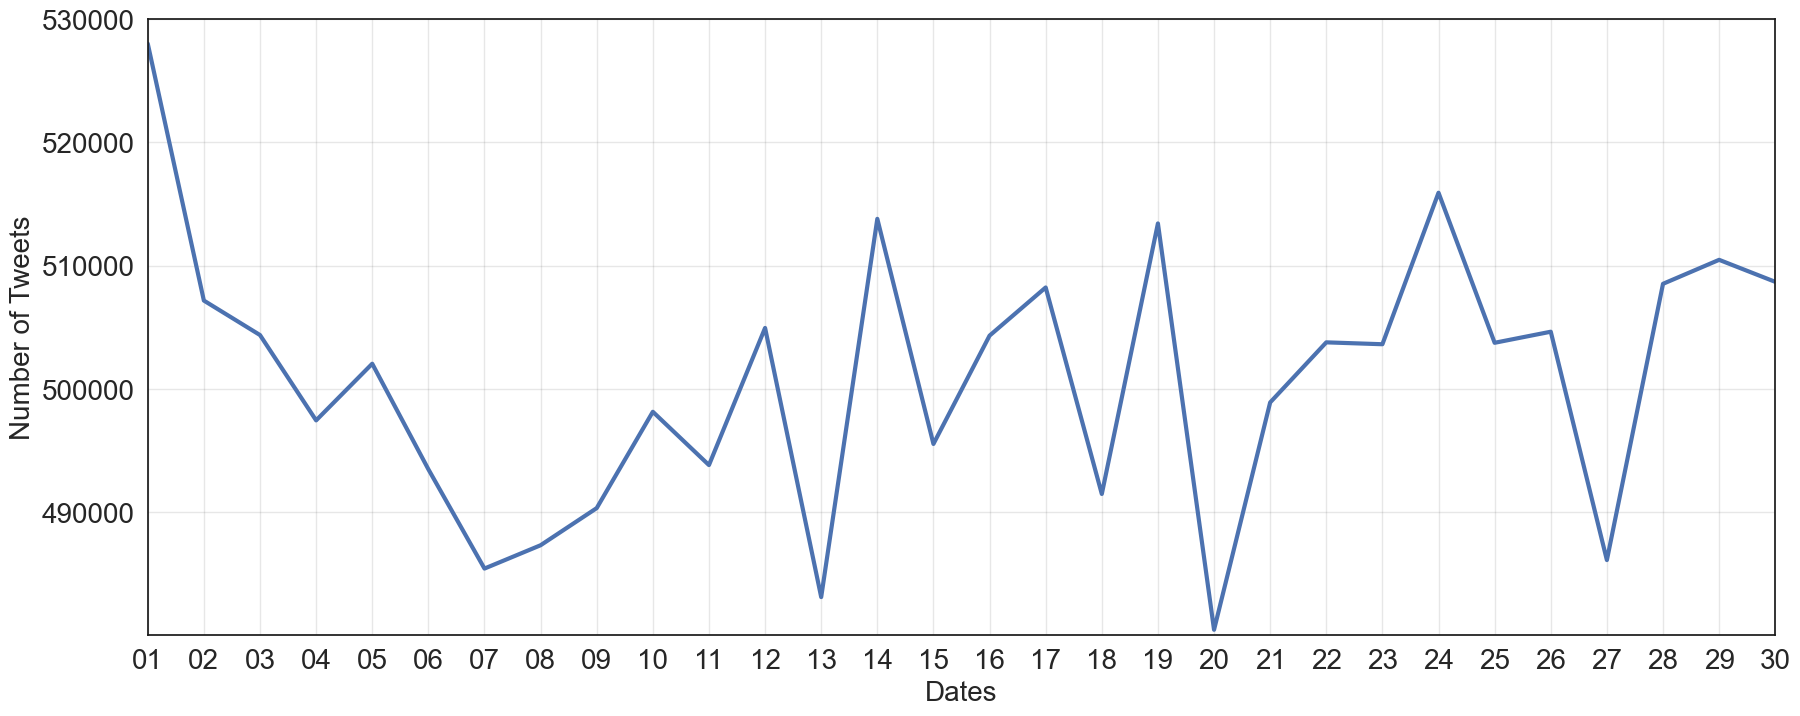
From the diagram above, we can find the Jun 1 has the highest number of tweets per day and the Jun 20 has the lowest number of tweets. The daily tweets are dropped generally from Jun 1 to Jun 7 and it’s fluctuating for the rest of the month.
1.3 Box diagram comparing weekdays and weekends⌗
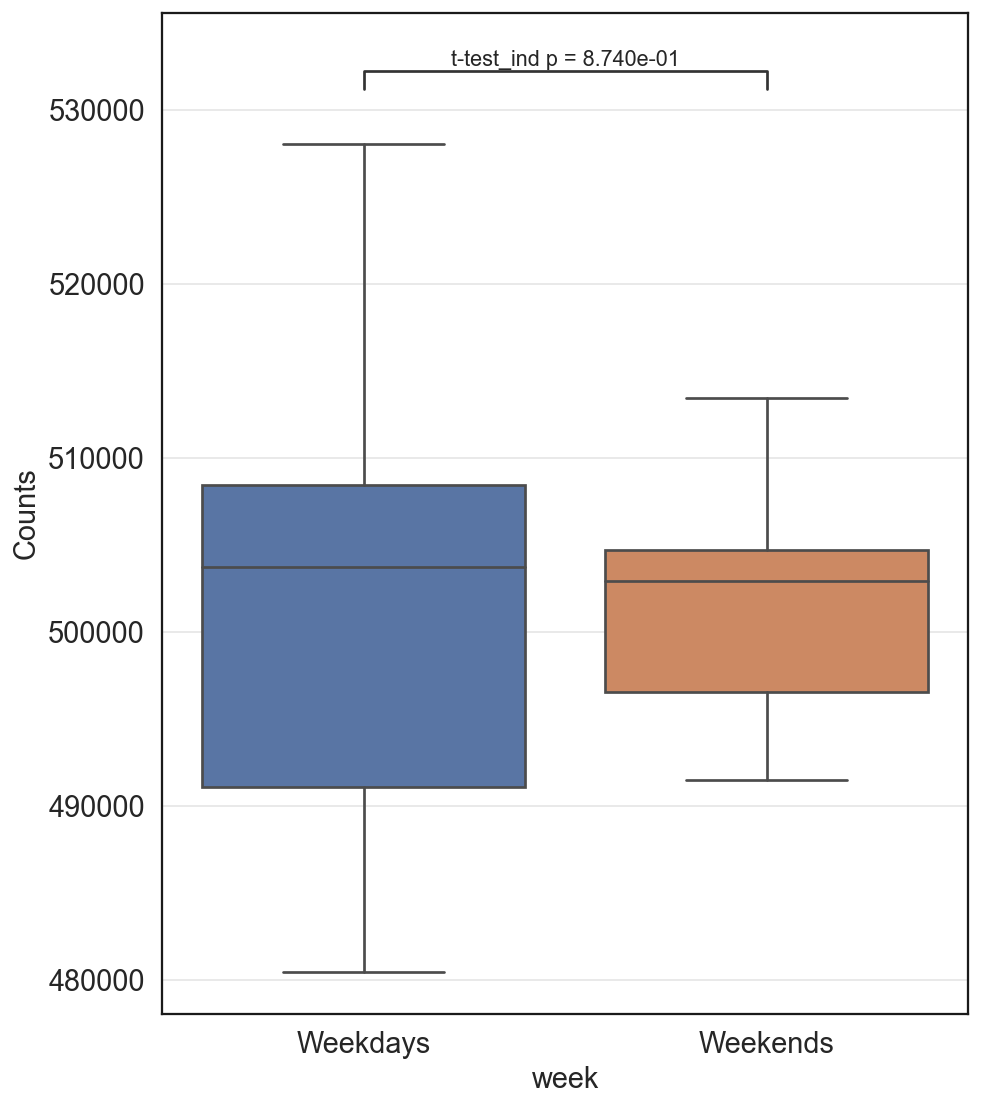
Figure 1.2 is a box diagram comparing the average number of tweets on weekdays and weekends, which shows that the range of the average tweets on weekdays is larger than the range of them on weekends, while the mean of average tweets on weekdays is higher than the mean of average tweets on weekends. For Weekdays vs. Weekends: t-test independent samples, p value is 0.8740, t value is -0.16 and it’s insignificant.
1.4 Averaged weekdays tweets by hours⌗
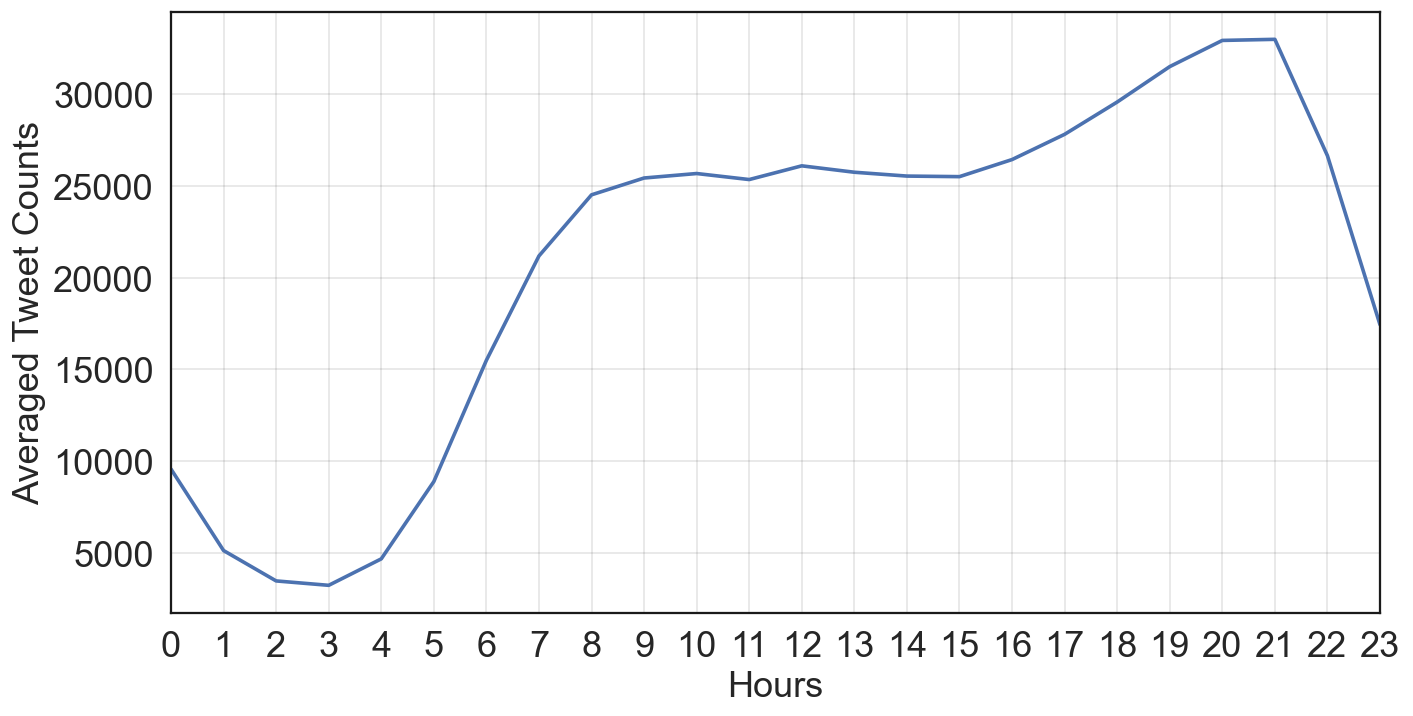
From the diagram above, can observe the tweet counts significantly rise from 4:00 to 8:00 and have a flat line till 15:00 and reach the peak at 20:00. Later, the tweet counts are dropped significantly from 21:00 to 1:00 the next day and reach the bottom at 3:00.
2. Users⌗
2.1 Histogram⌗
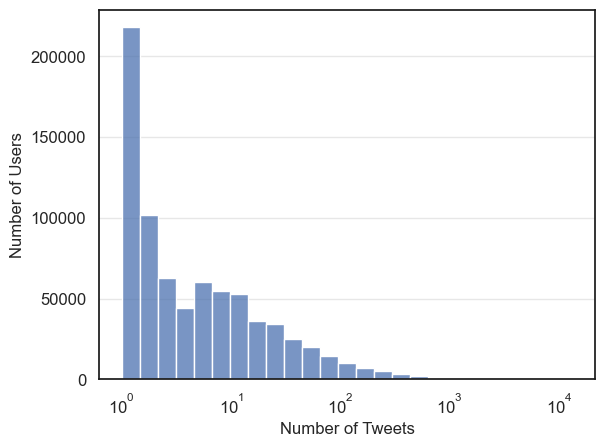
From the diagram above, we can observe most majority users tweet less than 3 and there is a significant long tail on this diagram which means there are very few users who have much more tweets than the majority. The long tail is caused by automated accounts which will be discussed in this report.
2.2 Top five users⌗
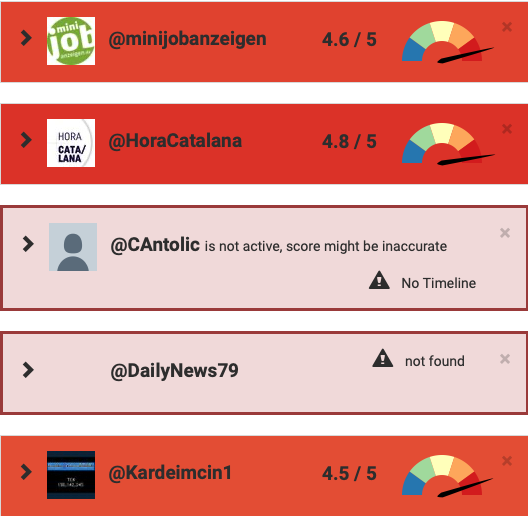
The top 5 users are:
- Kardeimcin1 with 13373 tweets
- DailyNews79 with 12518 tweets
- c_antolic with 11627 tweets
- HoraCatalana with 11293 tweets
- minijobanzeigen with 10085 tweets
All users are automated accounts(bots) with unexpected tweets number per day with patterns of their tweets:
@Kardeimcin1 seems to target Turkish readers, re-tweeting politicians’ tweets with images. From the earliest tweets, this account published 4 tweets in 15 seconds with images. This account looks like a political bot.
The images it tweeted contain a string of text and numbers 158, 142, and 245. After applying OSINT, found it’s asking for compromise or reconciliation of article 158: Qualified Fraud Crime, article 142: Qualified Theft Crime, and article 245: Misuse of Bank or Credit Cards Offense in Turkey.
@DailyNews79 tweets headlines of multiple media of different languages and will all tweets contain an advertisement URL in the end. This account has been disabled by Twitter. This account sent tweets almost every minute.
@cantolic tweets random pictures, links, and German-based words. The earliest 3 tweets are sent in 14 seconds.
@HoraCatalana is a bot that tweets time in the Catalan time system.
@minijobanzeigen is a bot made by @MicaloCal that tweets job infomation from minijob-anzeign.de.
This result can be cross verified by bot checker Botometer, an OSoMe(The Observatory on Social Media) project by Indiana University.
2.3 Top five users being mentioned⌗
Answer: The top 5 users who receive the most mentions are:
- @YouTube
- @RTErdogan
- @BorisJohnson
- @elonmusk
- @GBNEWS
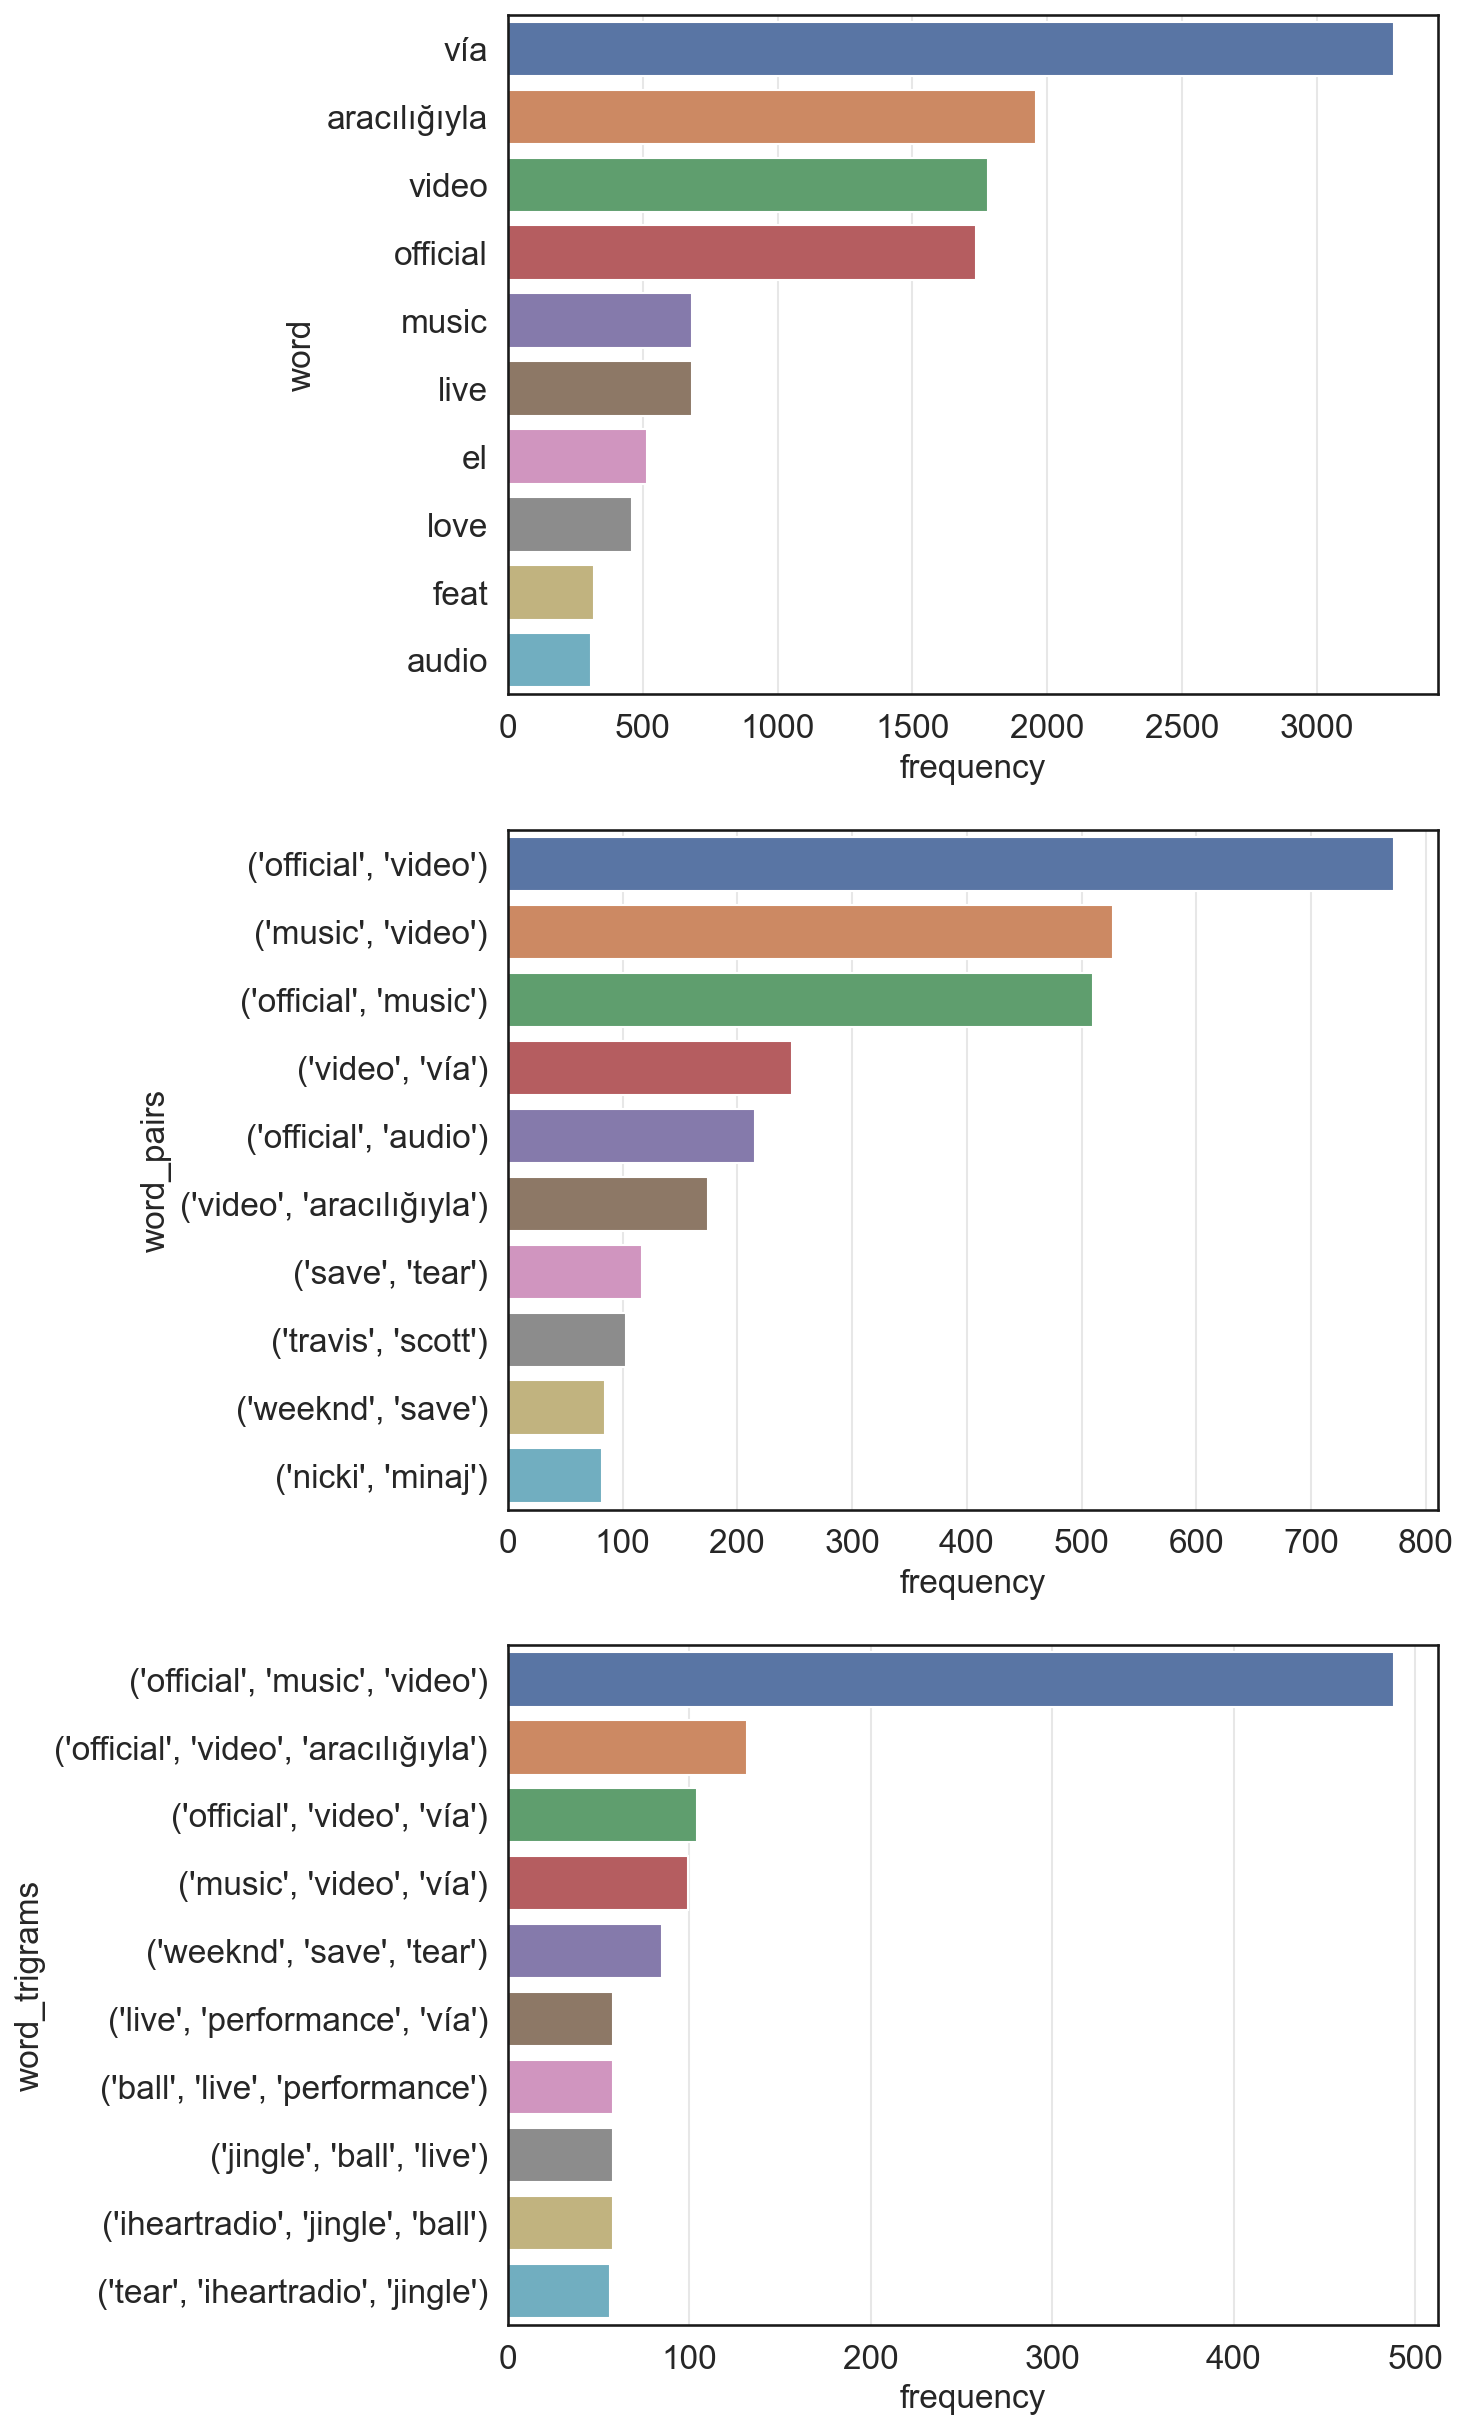
@YouTube is the Twitter account of YouTube. From word frequency, we can observe the hot words are via, aracılığıyla, Official Video, Official Music, and Music Video. This shows majority mention YouTube because of sharing YouTube videos like music videos on Twitter.
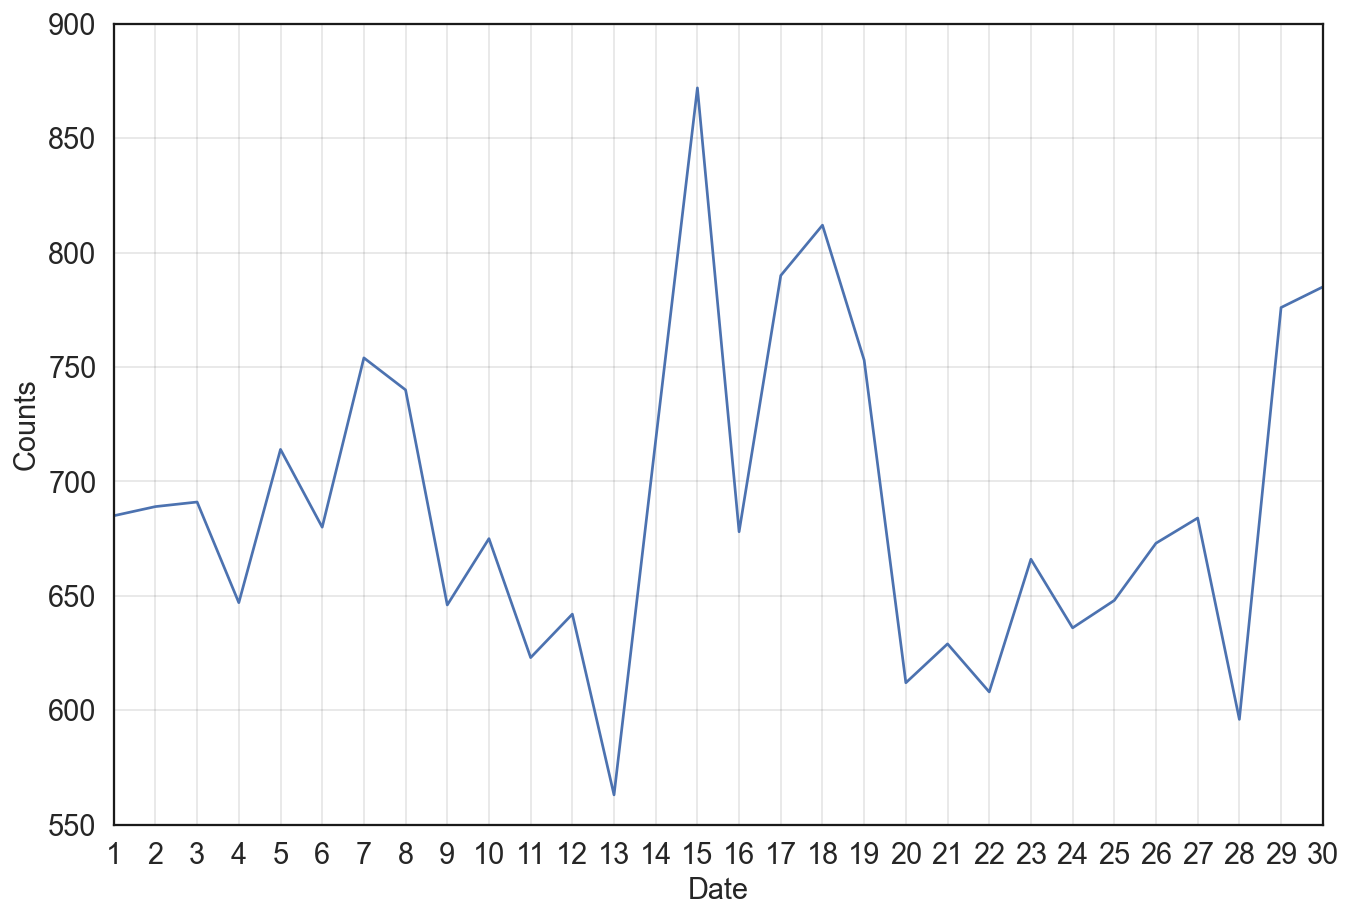
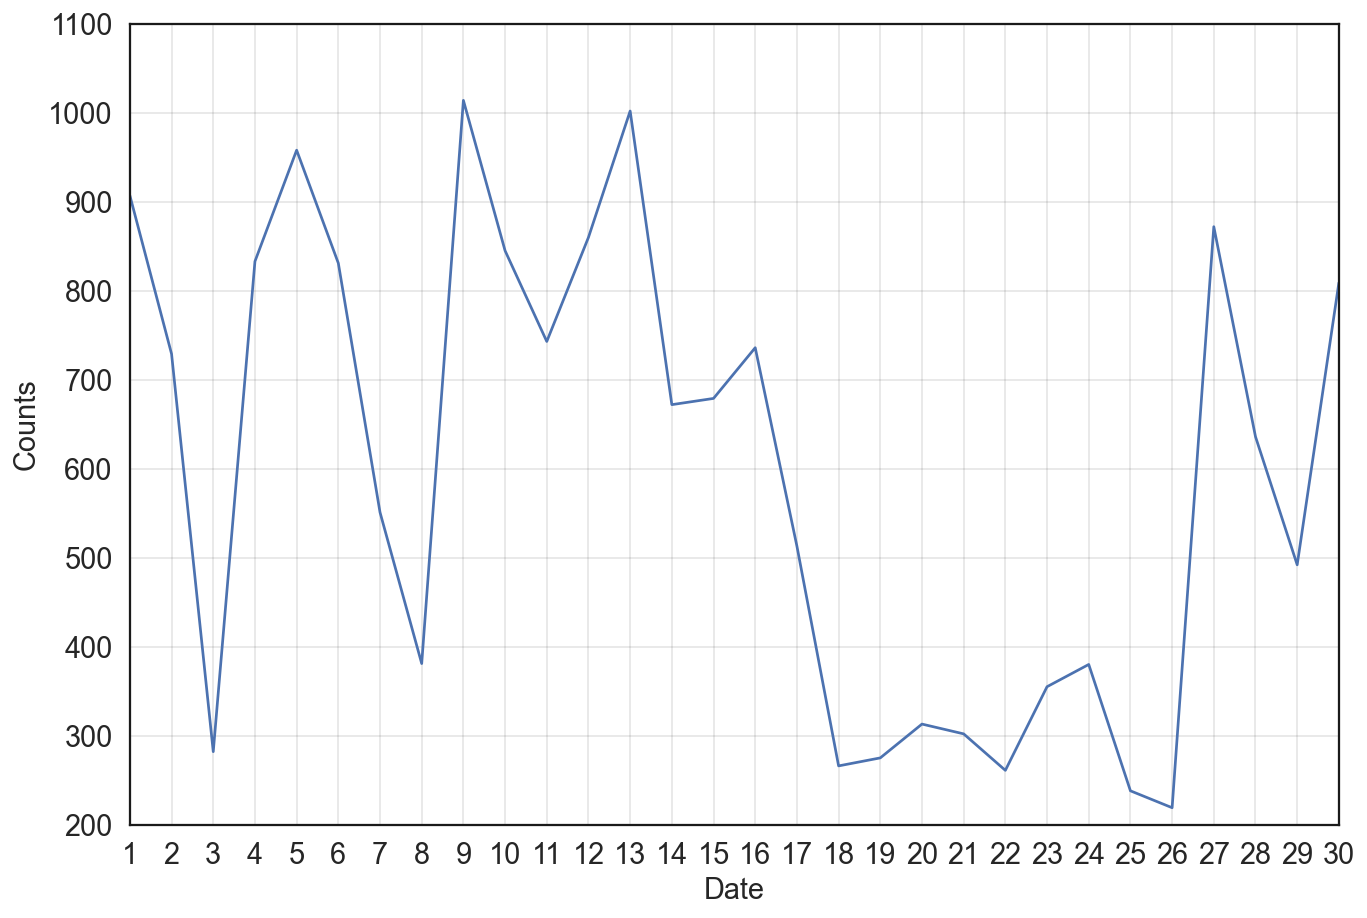
User mentions reached to peek on June 15 and the second peek on June 18. And user mentions reached to peek at 18:00 BST and remains at high until 21:00 BST daily.
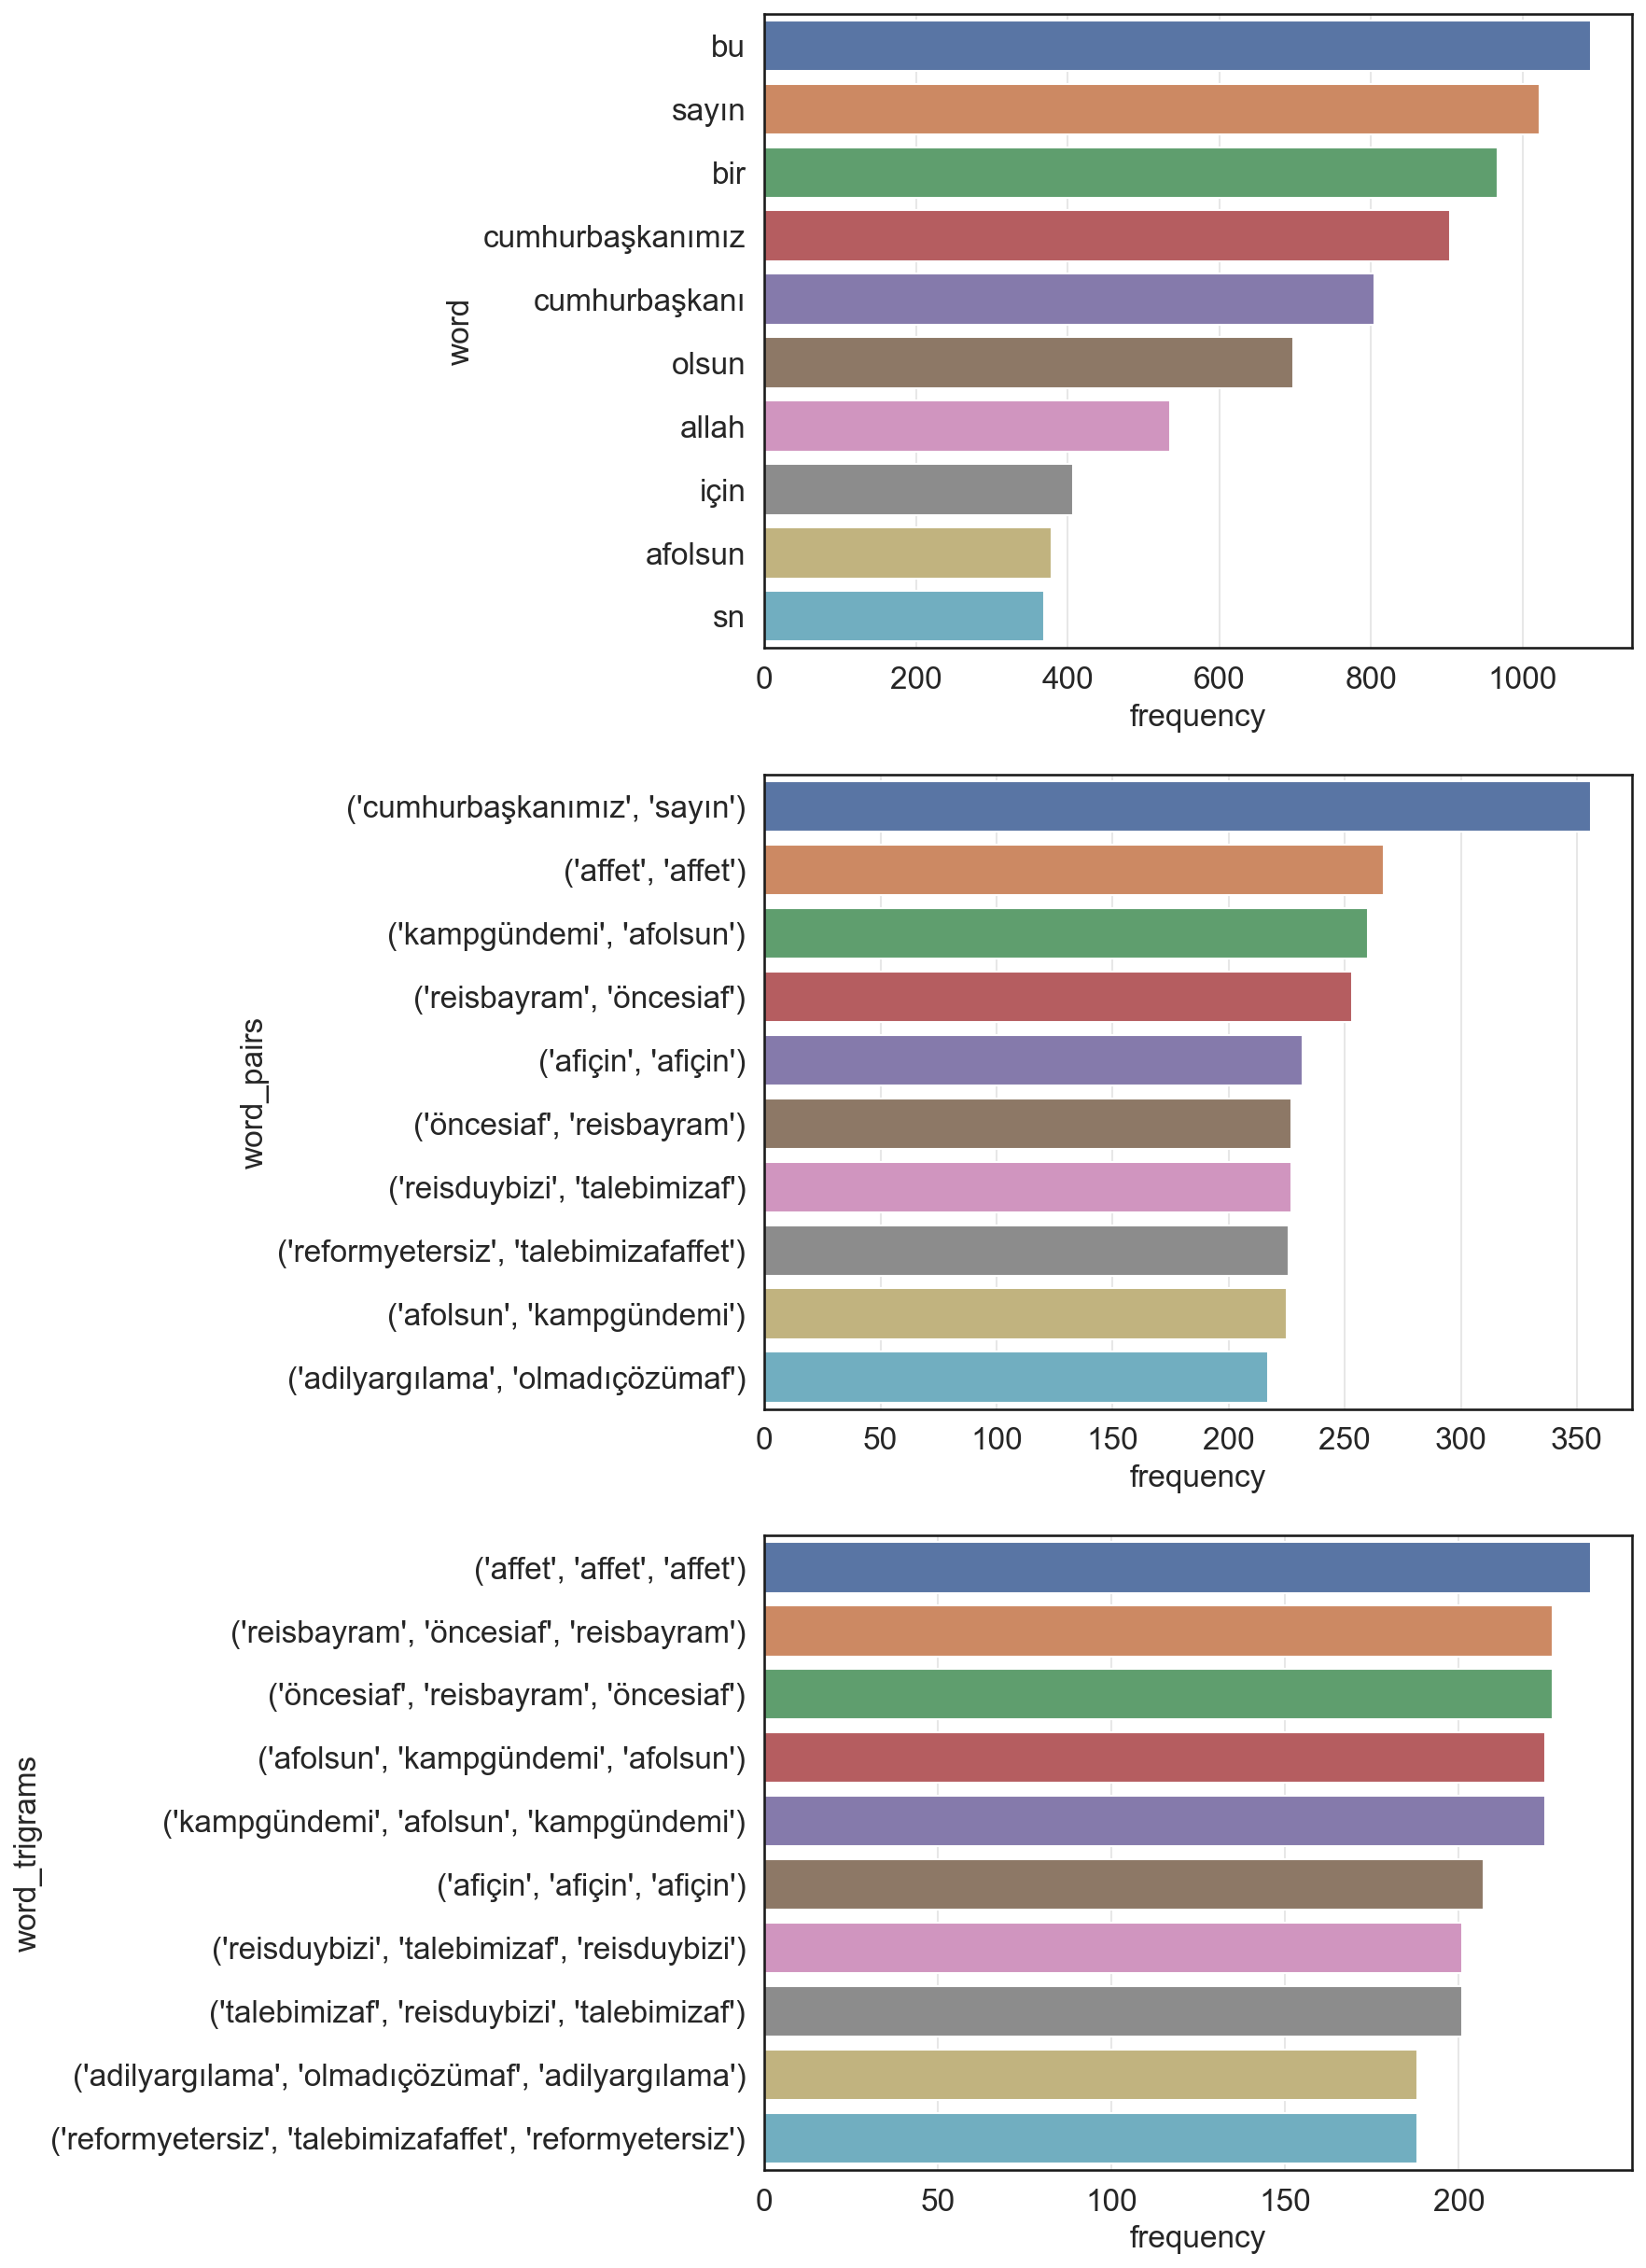
@RTErdogan is the Twitter account of Turkish president Recep Tayyip Erdoğan. From word frequency, the most mentioned word when users mention President Erdoğan is cumhurbaskanimiz sayin(our honourable president). It is highly because of current Turkish president Recep Tayyip Erdoğan declared his bid for president in 2023 election on June 9 which he received relatively higher mention than on other days.
The mention amount is relatively higher than on other days on June 1, 5, 9, and 13. User mentions increased significantly from 17:00 BST and reached the peak at 18:00 BST.
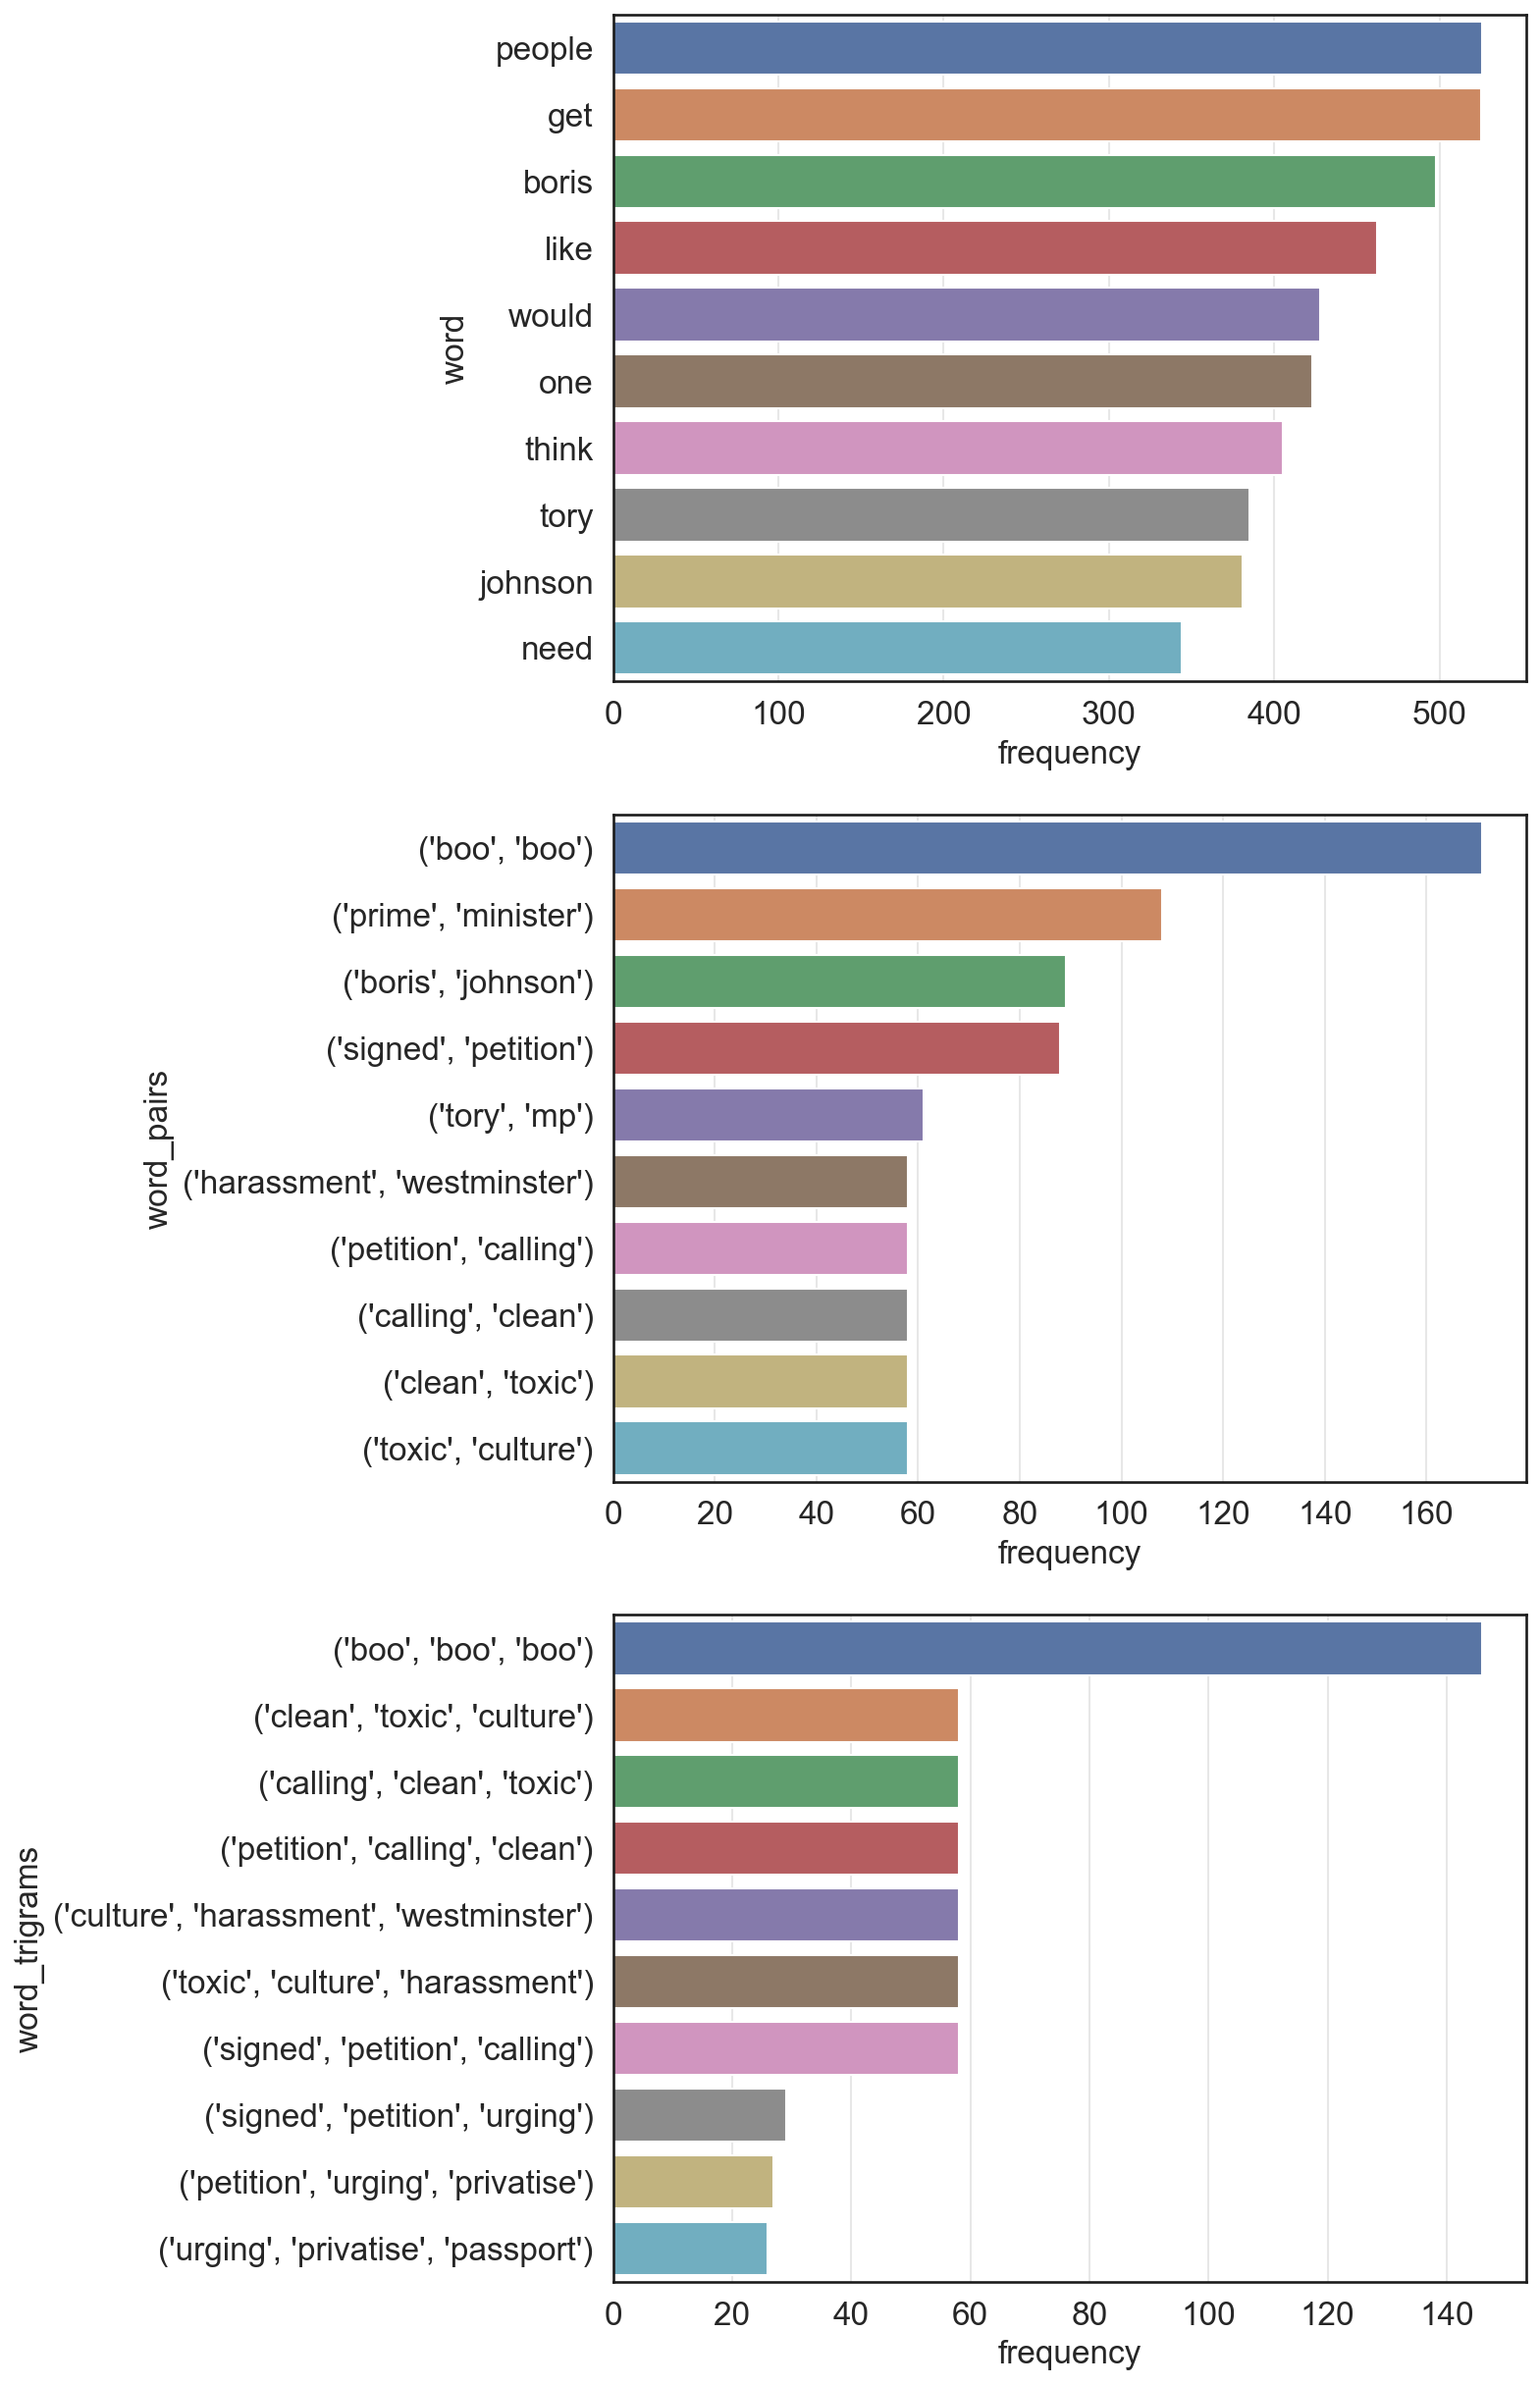
@BorisJohnson is the Twitter account of former British Prime Minister Boris Johnson. The word frequency shows that he was most mentioned by words boo, signed petition, toxic culture. And there are two politicians, Priti Patel and Nadine Dorries, were mentioned. Both politicians are the allies of Boris Johnson, according to the news.
User mentions are significantly high on June 6 as Boris Johnson went to address the 1922 Committee and later won the no-confidence vote for the Partygate.
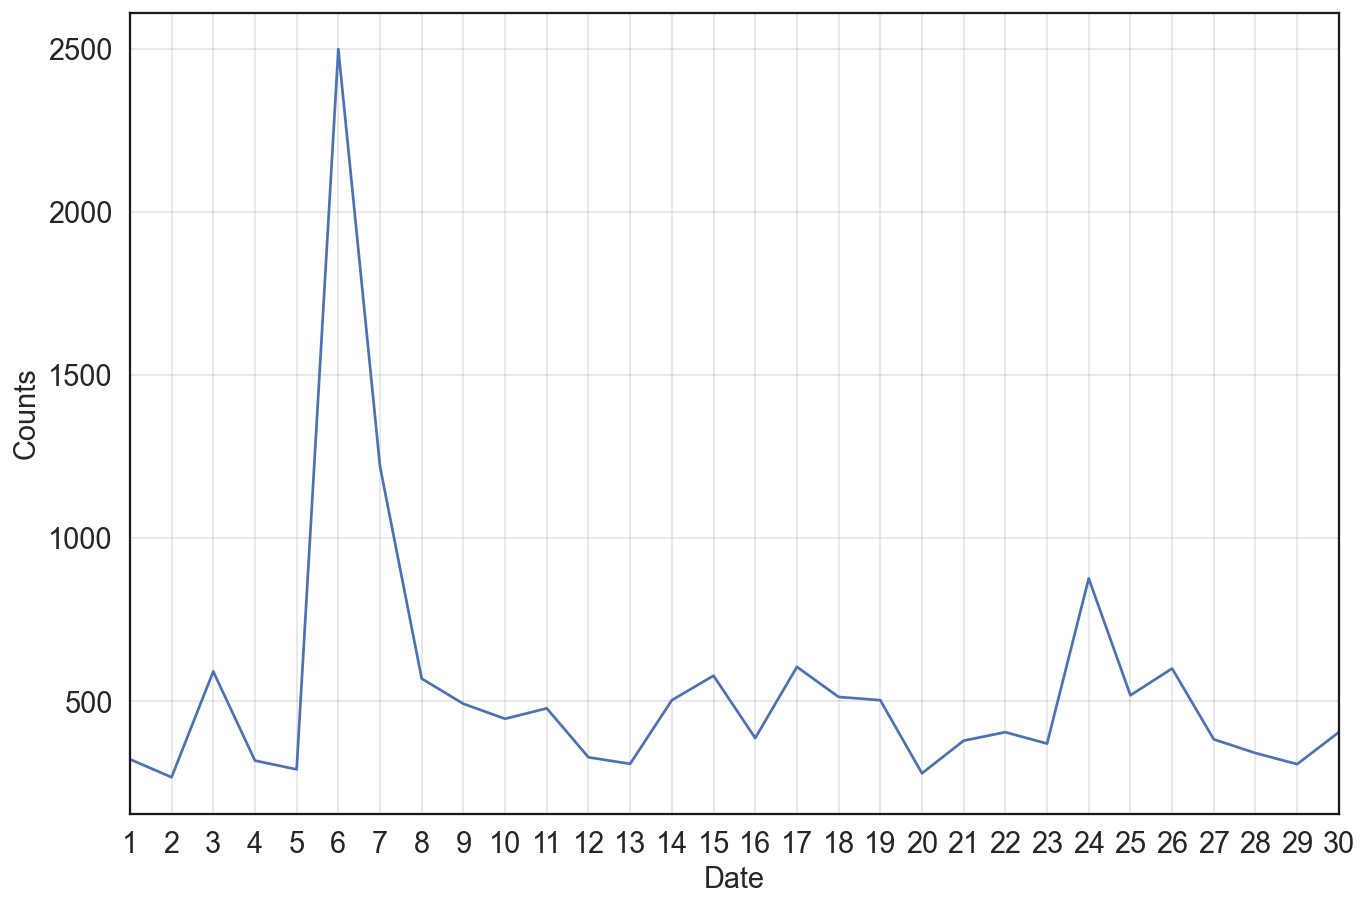
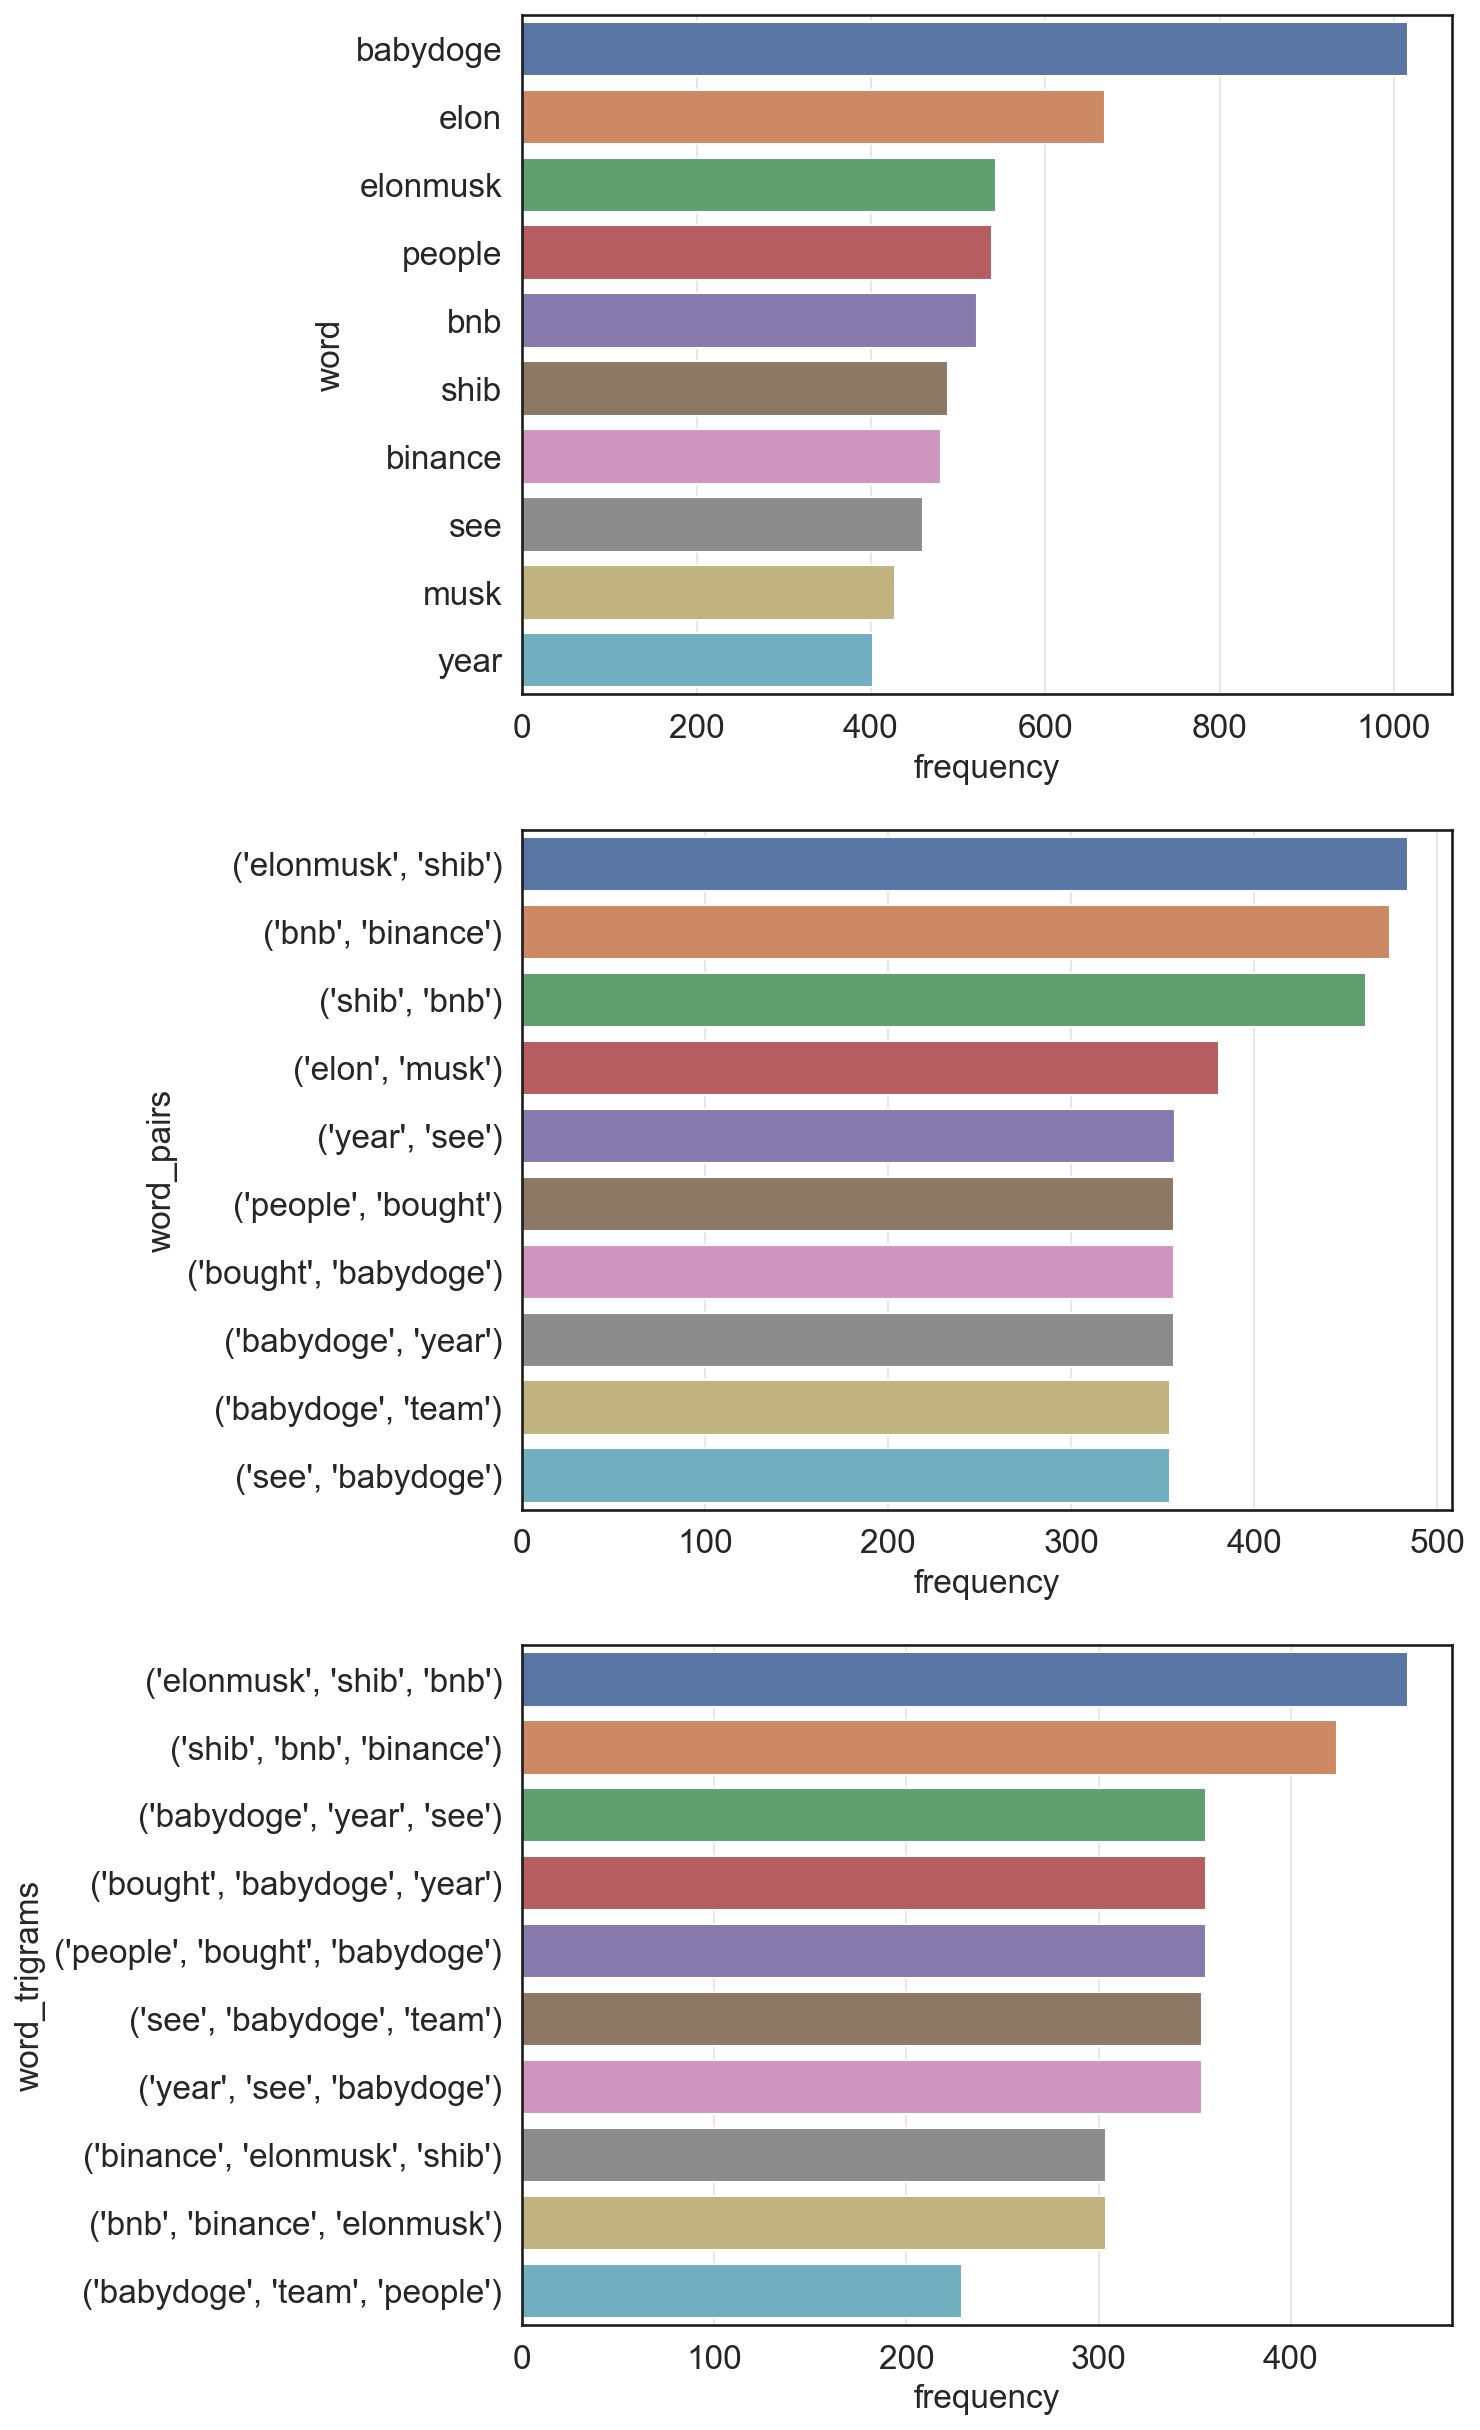
@elonmusk is the Twitter account of Elon Musk. The word frequency shows that he was most mentioned by words bnb, binance, and shib. After checking on the original tweets, could find most of these mentions are advertisements of cryptocurrencies. The mentions reached the first peak on June 5 and reached the second peak on June 18.

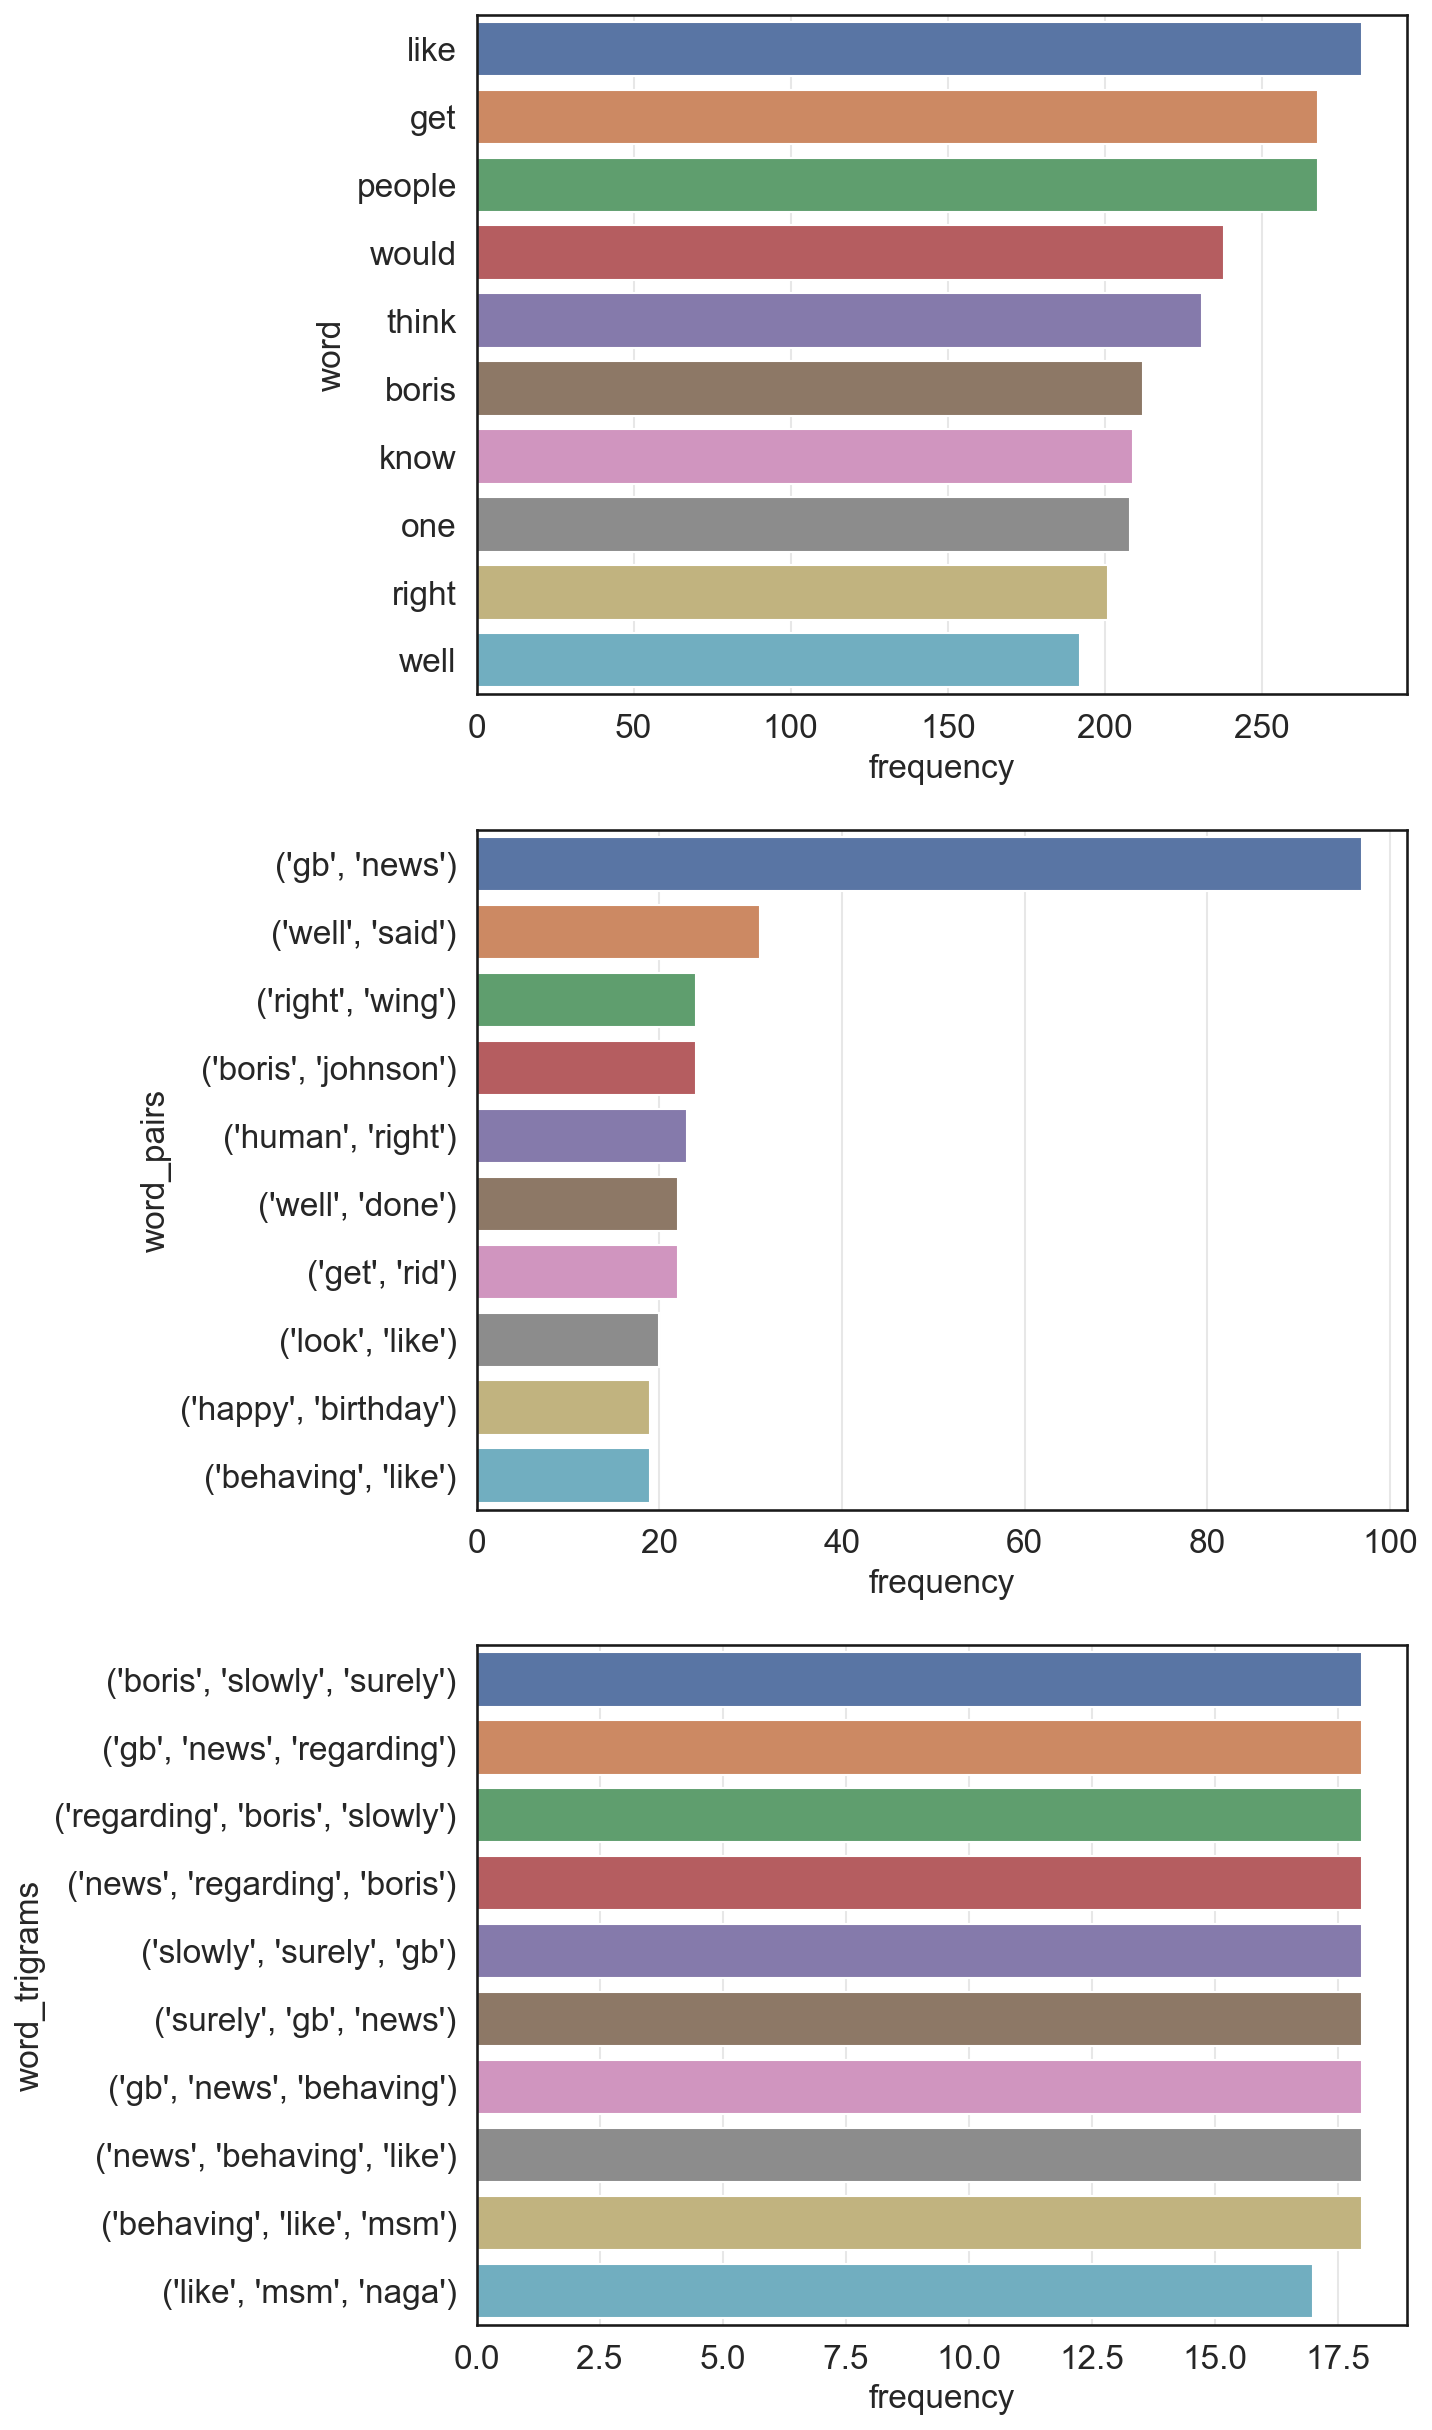
@GBNEWS is the Twitter account of GBNews. Users also mention Nigel Farage when mentioning GBNews. The hot words that are interesting from the word frequency are right wing, boris johnson, far right. The mention reached to the peak on June 6 as the news of Boris Johnson getting comments. The mentions have 2 peaks daily, the first peak is at 8-9 during the morning news programme and the second peak is at 19:00 during Nigel Farage’s prime-time show.
2.4 Countries mention comparation⌗
Select the UK, France, Portugal, and Italy as objects and computed below table. The country name is matched by using the country_code under place tag. If a user has multiple country_code select the one counts the most.
| GB | FR | PT | IT | |
|---|---|---|---|---|
| GB | 39511 | 1564 | 483 | 973 |
| FR | 1173 | 8996 | 227 | 465 |
| PT | 346 | 406 | 1123 | 89 |
| IT | 863 | 126 | 117 | 4502 |
If we use the number one country mentioned the other minus that country mentioned back and get the below table. Negative numbers mean more mention received than mentioned.
| GB | FR | PT | IT | |
|---|---|---|---|---|
| GB | 0 | 391 | 137 | 110 |
| FR | -391 | 0 | -179 | 339 |
| PT | -137 | 179 | 0 | -28 |
| IT | -110 | -339 | 28 | 0 |
From the above two tables, we could observe that all countries are more likely to mention users from their own countries. The UK users received more mentions than they mention others. French users mentioned UK users more than others. Italy users are most likely not to mention other countries among these four countries.
3. Maps⌗
3.1 Twitter usage across Europe⌗
Figure 3.1 is a map of European countries with Twitter usage by small regions across Europe. These small regions are defined by NUTS 2021 classification (Nomenclature of territorial units for statistics) level 3, provided by Eurostat, GISCO(the Geographic Information System of the COmmission). The map contains EU member states, EU candidate countries, and the UK.1 All OMR(The Outermost Regions) has been excluded.
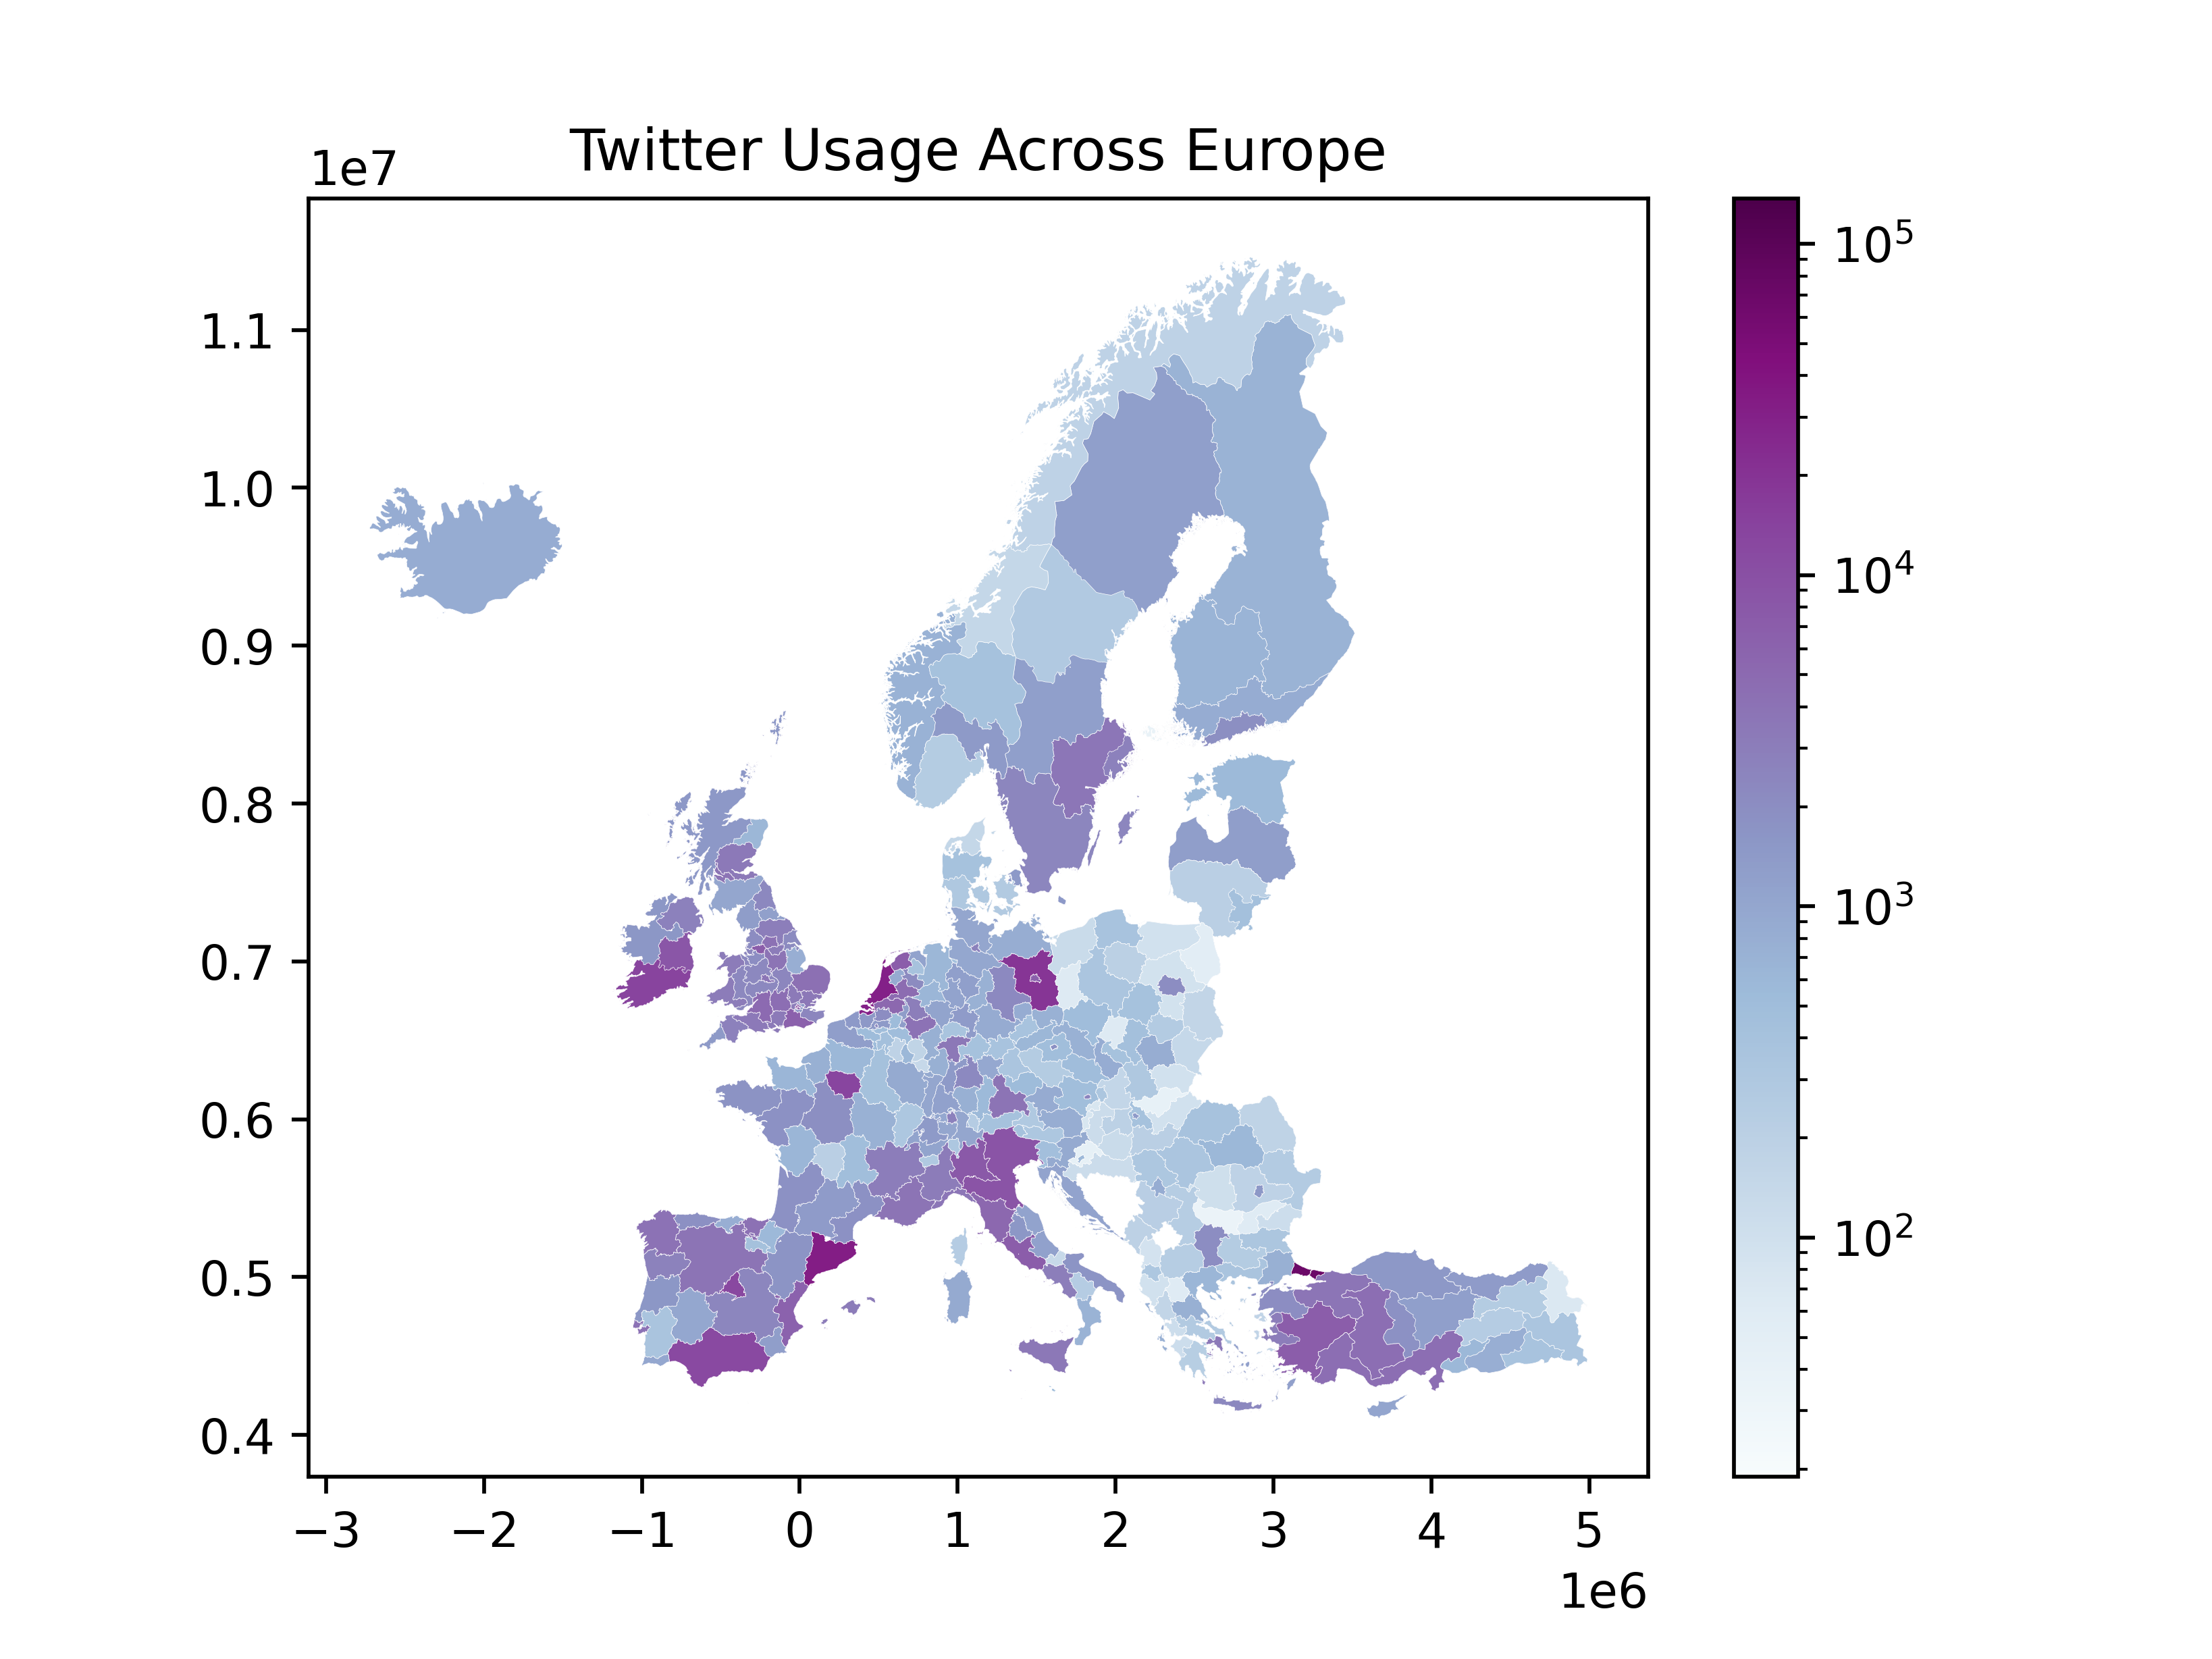
3.2 Patterns observed⌗
From figure 3.1, we can find there are more tweets sent from the loction of large metropolitan areas. The significant areas with high tweets are İstanbul, Catalonia, Brandenburg, Inner London, Île-de-France, North Holland, and Community of Madrid. Except for Catalonia, all other areas contain the capital city of the country. The number of tweets is relatively lower in Balkan countries and other post-Soviet states than in other Europe countries. And the nordic countries has less tweets than the western Europe countries.
3.3 CDF of the bounding box diagonals⌗
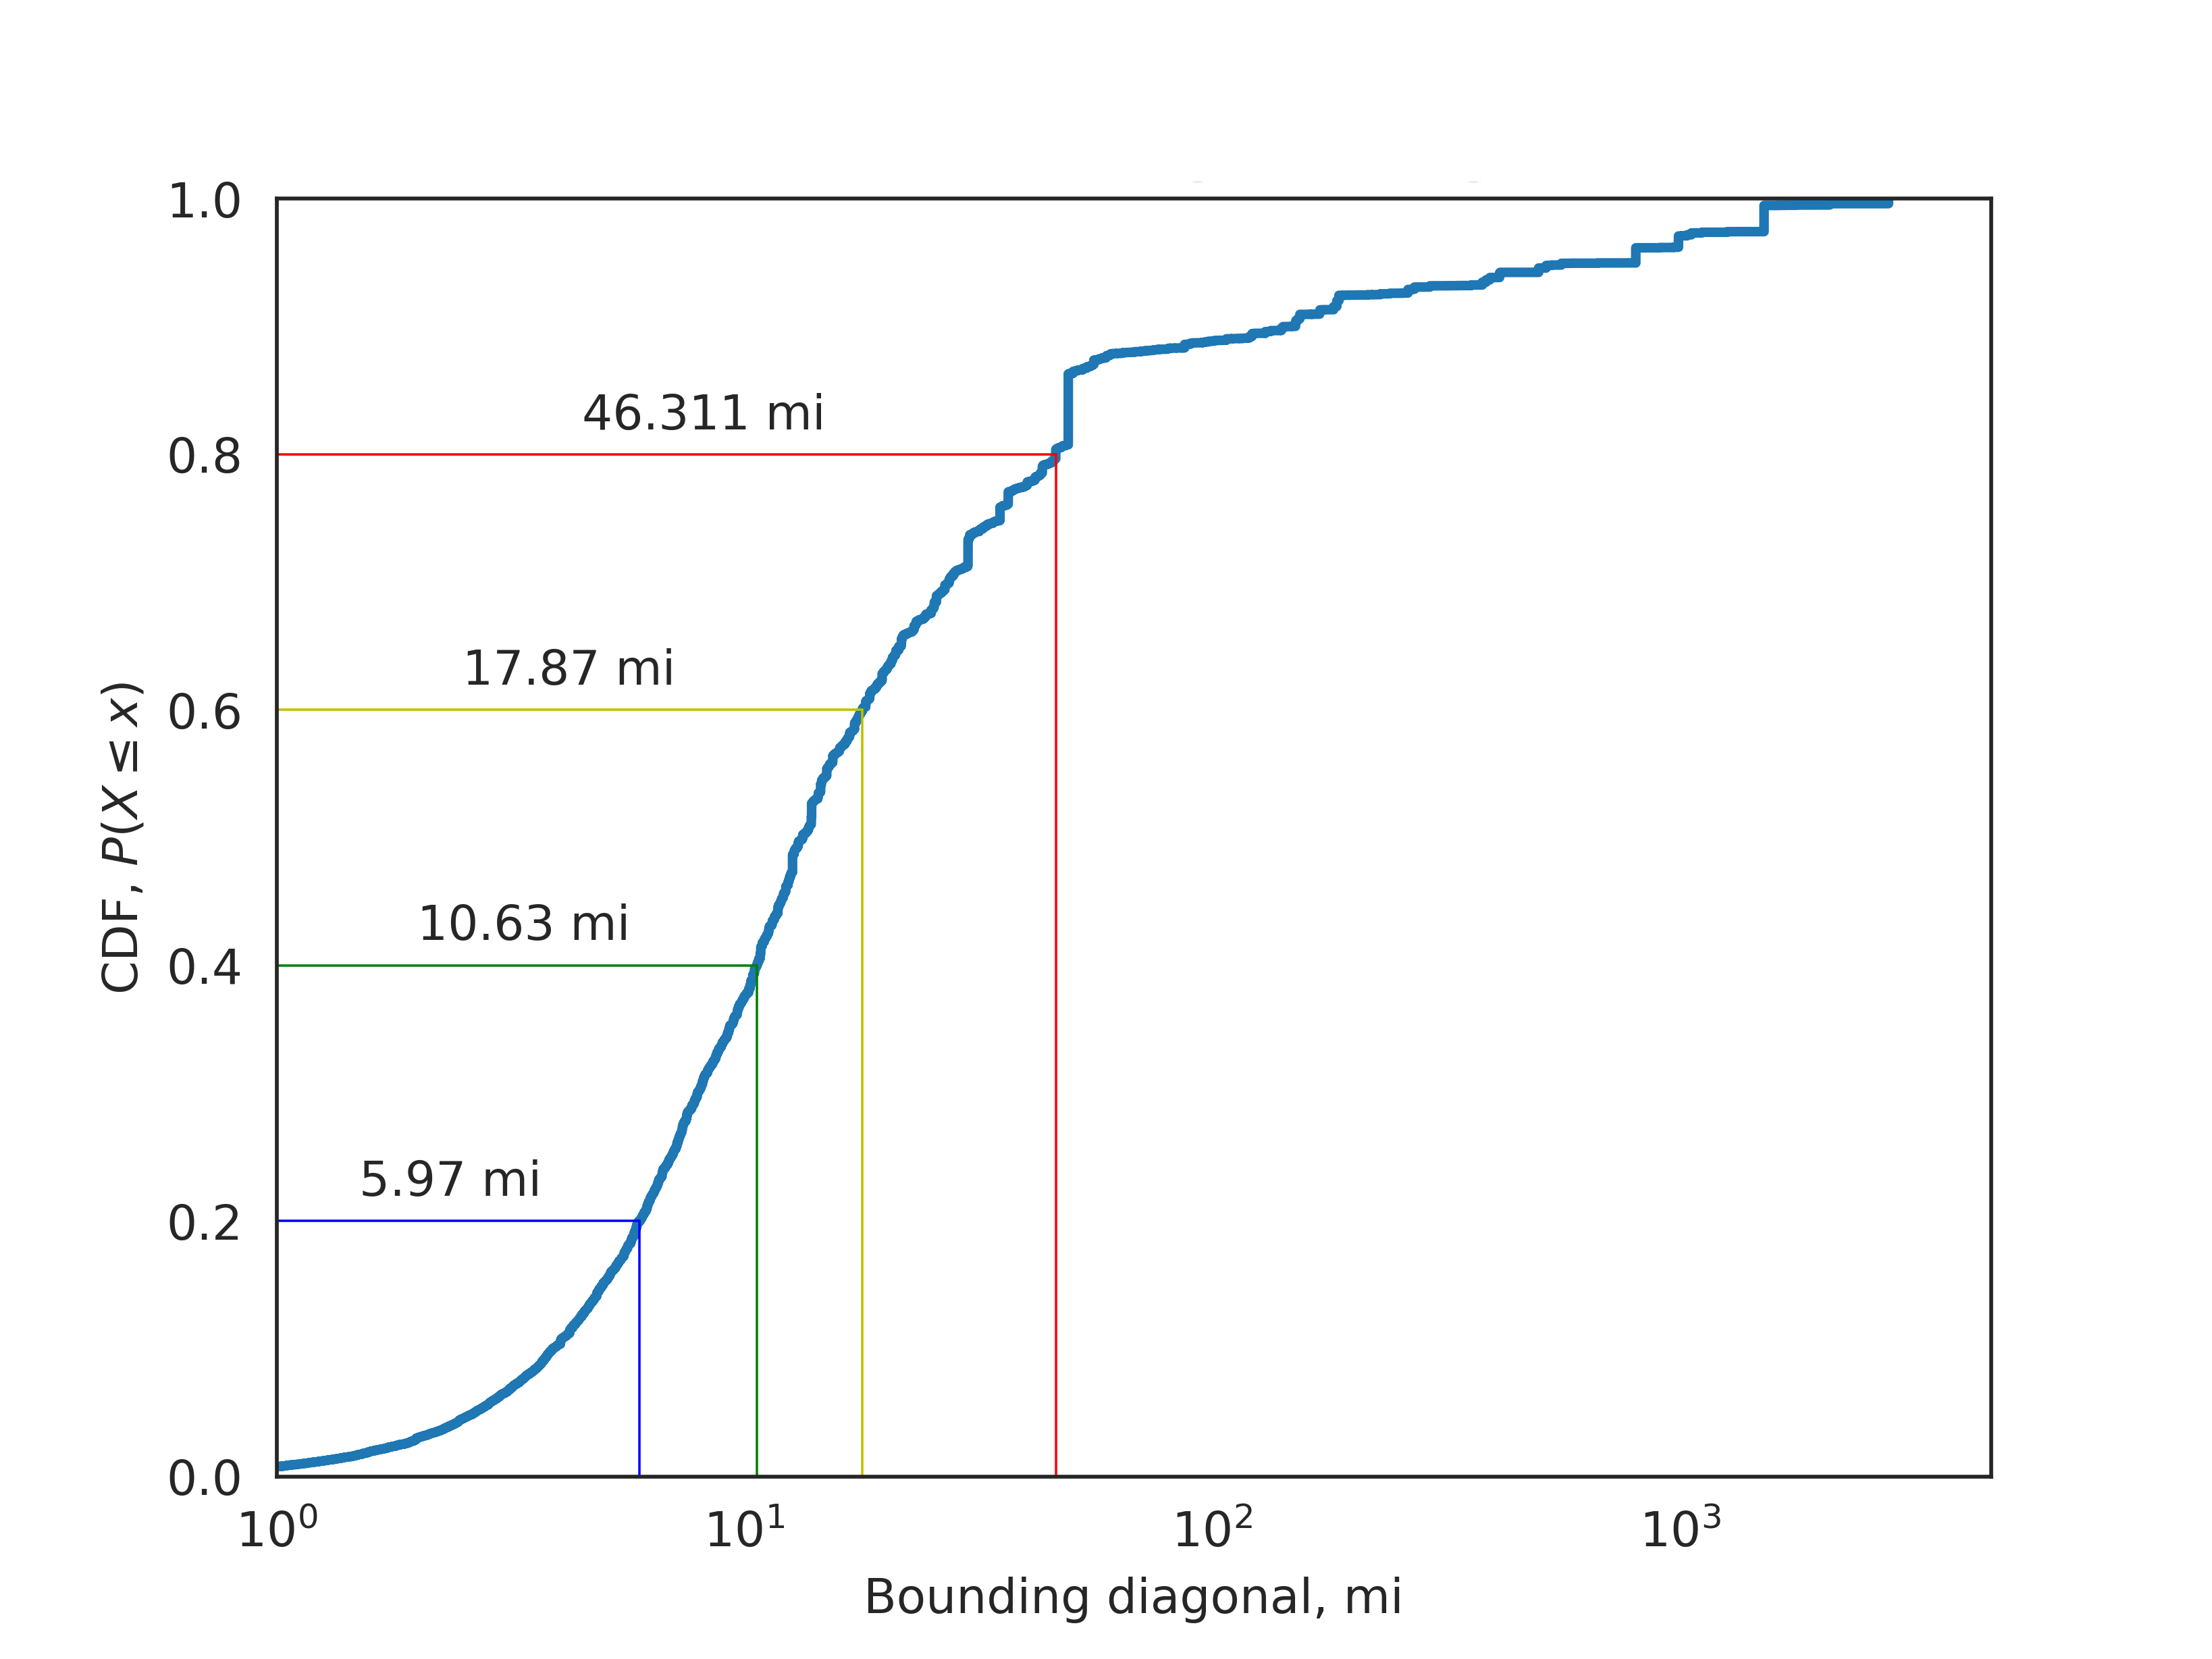
The bounding box under place tag in tweet metadata is usually a rectangular bounding box. Measured diagonals by using the coordinates provided and transfer the diagonal length to miles. Figure 3.3 shows the CDF of the proportion of total tweets as box size increases. There are 80% of tweets that their bounding box diagonals are less than 46.311 miles, while 20% of tweets that their bounding box diagonals are less than 5.97 miles.
3.4 Comparing population and tweet counts in Germany⌗
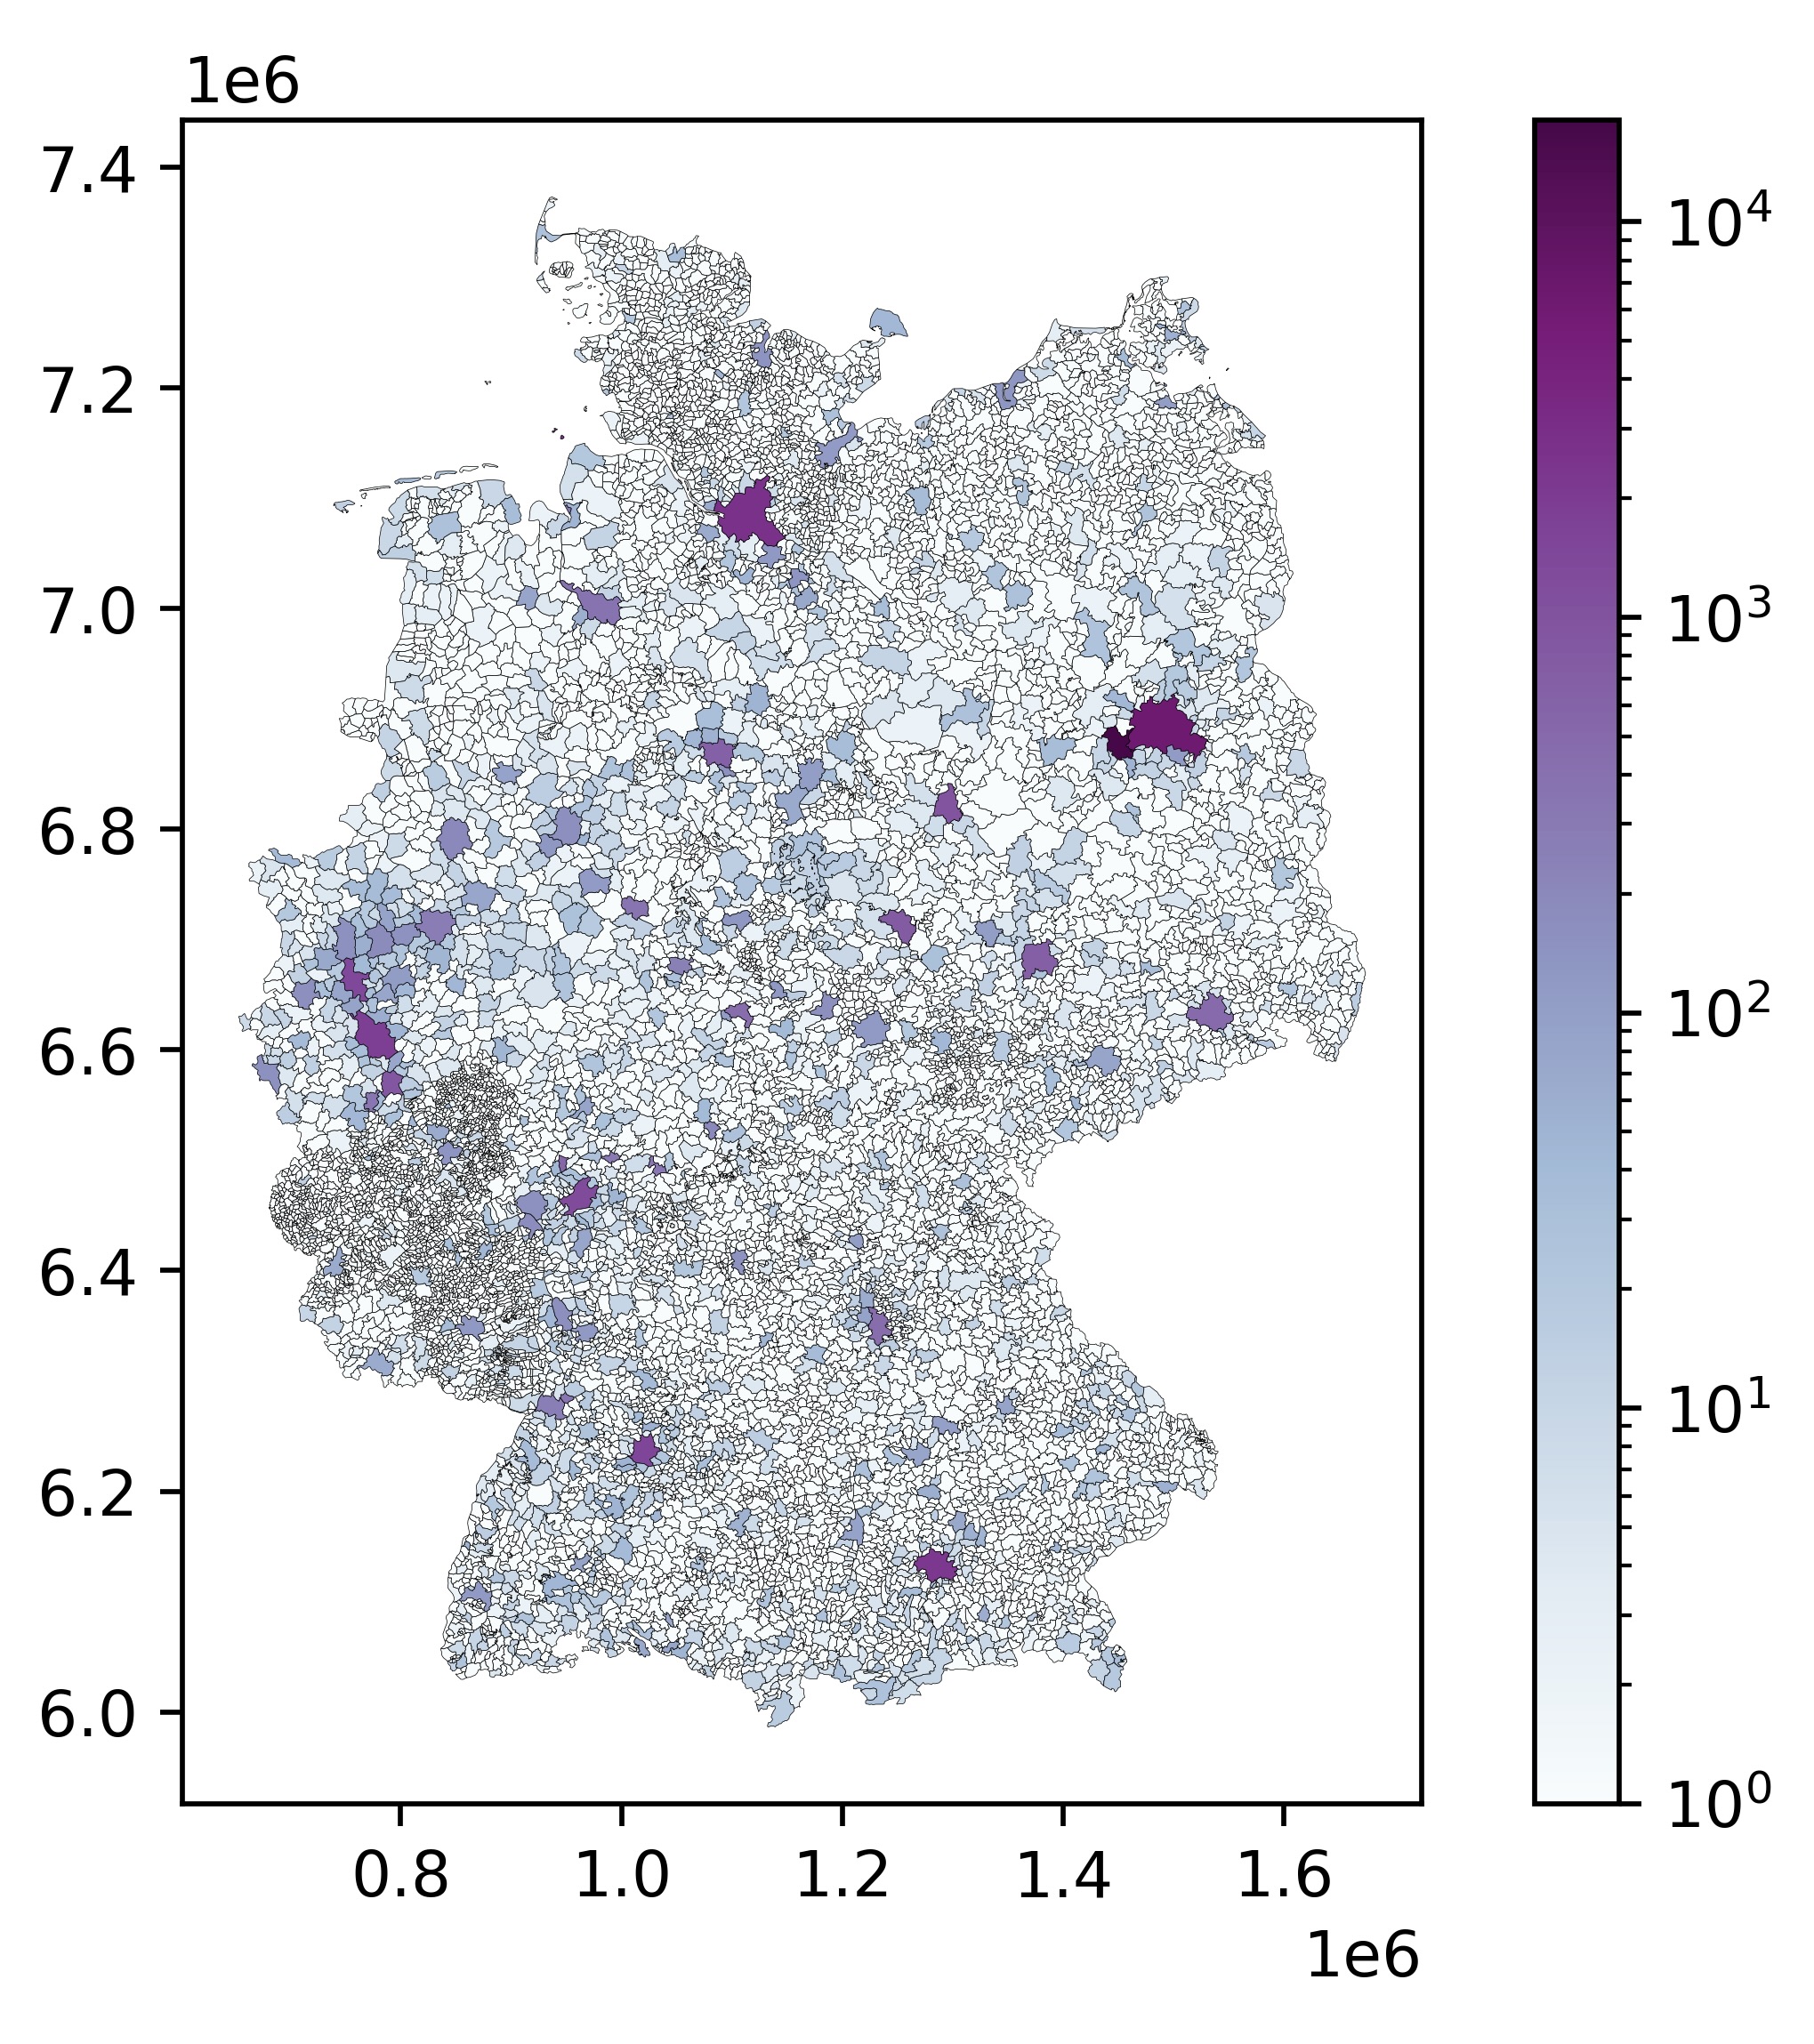
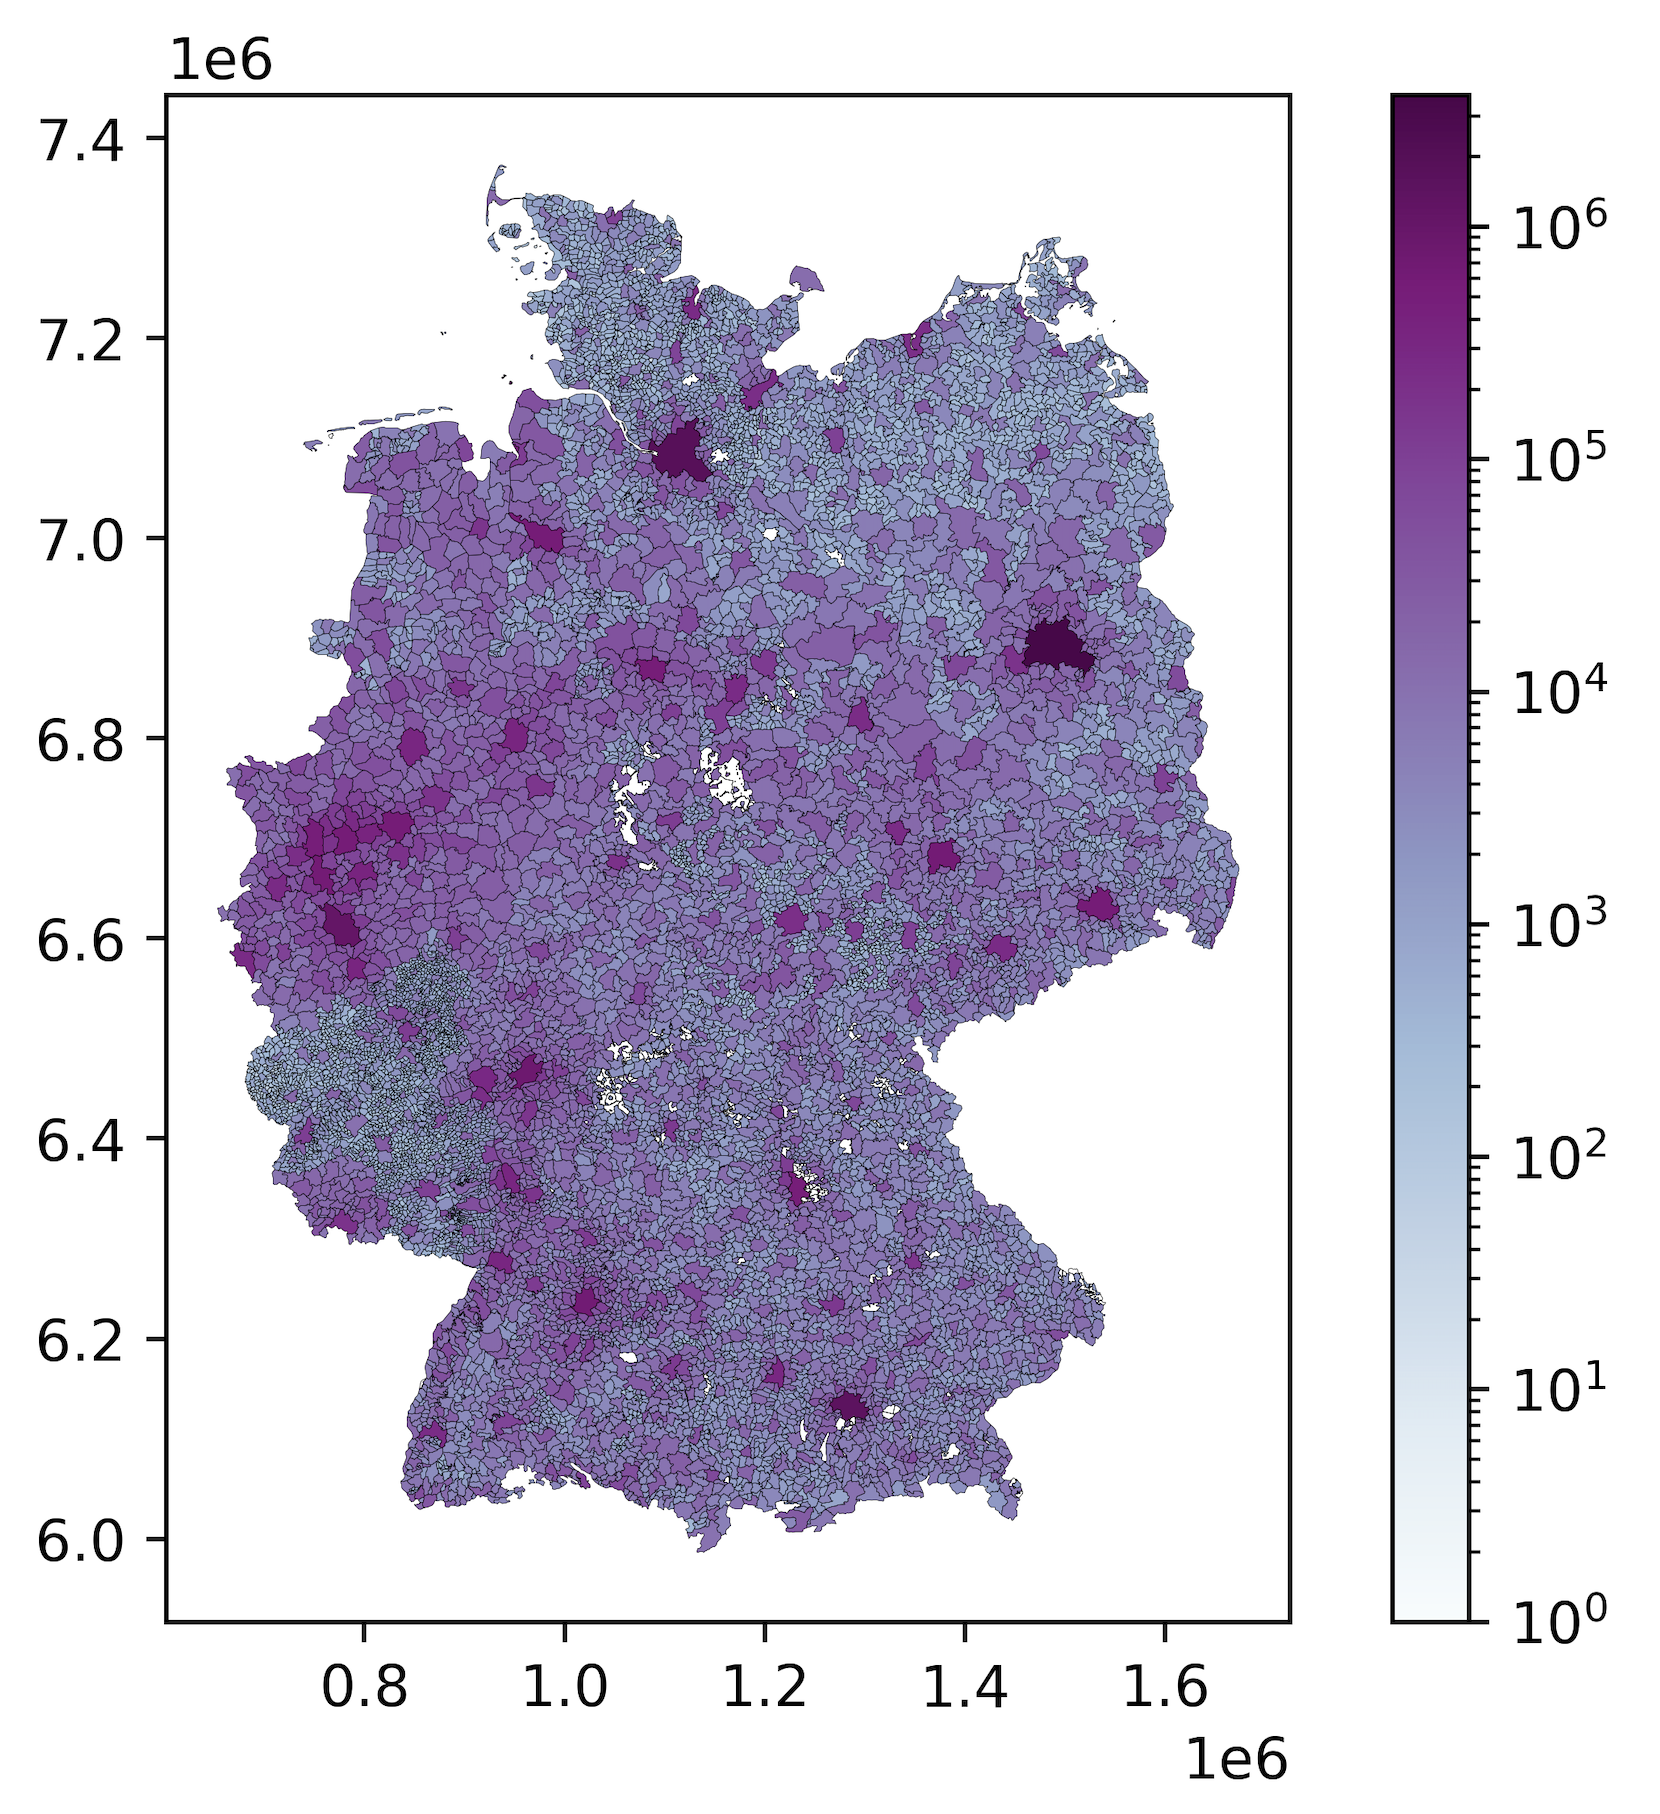
Figure 3.3 is the map of Twitter usage across Germany and figure 3.4 is the map of the population in Germany. Population data comes from LAU(Local Administrative Unites) 20202 and plot the map by LAU regions.
These two figures show that urban areas have more population, and the number of tweets generally increase as the population increase. The top cities that have the most population in Germany are Berlin, Hamburg, Munich, and Cologne, all these cities also holds the largest tweet numbers across the country. The correlation coefficient between population and tweet counts is 0.416.
4. Events⌗
4.1 Unusual days in the UK, France and Portugal⌗
Count the total number of tweets and count the number of tweets with hashtag by country, exclude the top ten users with the most tweets which usually are bots, sorted by descending, and select the top five dates.
Top five dates in the UK:
| Created at (Total) | Counts | Created at (With hashtag) | Counts |
|---|---|---|---|
| 2022-06-24 | 131787 | 2022-06-04 | 14814 |
| 2022-06-01 | 125125 | 2022-06-02 | 14397 |
| 2022-06-14 | 124399 | 2022-06-01 | 13959 |
| 2022-06-02 | 122232 | 2022-06-24 | 13898 |
| 2022-06-17 | 121832 | 2022-06-05 | 13641 |
From the table, we can identify June 24 as the date with the unusually high activity which has the highest counts and it is also the top five which has the most tweets with hashtag.
Top five dates in France:
| Created at (Total) | Counts | Created at (With hashtag) | Counts |
|---|---|---|---|
| 2022-06-19 | 41185 | 2022-06-12 | 5072 |
| 2022-06-17 | 38130 | 2022-06-17 | 5039 |
| 2022-06-16 | 37730 | 2022-06-19 | 4970 |
| 2022-06-12 | 37483 | 2022-06-15 | 4775 |
| 2022-06-15 | 37074 | 2022-06-10 | 4772 |
From the table, we can identify June 19 as the date with unusually high activity that has the highest counts and it is also the top five which has the most tweets with hashtag.
Top five dates in Portugal:
| Created at (Total) | Counts | Created at (With hashtag) | Counts |
|---|---|---|---|
| 2022-06-30 | 8568 | 2022-06-05 | 729 |
| 2022-06-19 | 8506 | 2022-06-30 | 652 |
| 2022-06-01 | 8492 | 2022-06-19 | 624 |
| 2022-06-02 | 8444 | 2022-06-29 | 605 |
| 2022-06-29 | 8434 | 2022-06-03 | 584 |
From the table, we can identify June 30 as the date with unusually high activity that has the highest counts and it is also the top five which has the most tweets with hashtag.
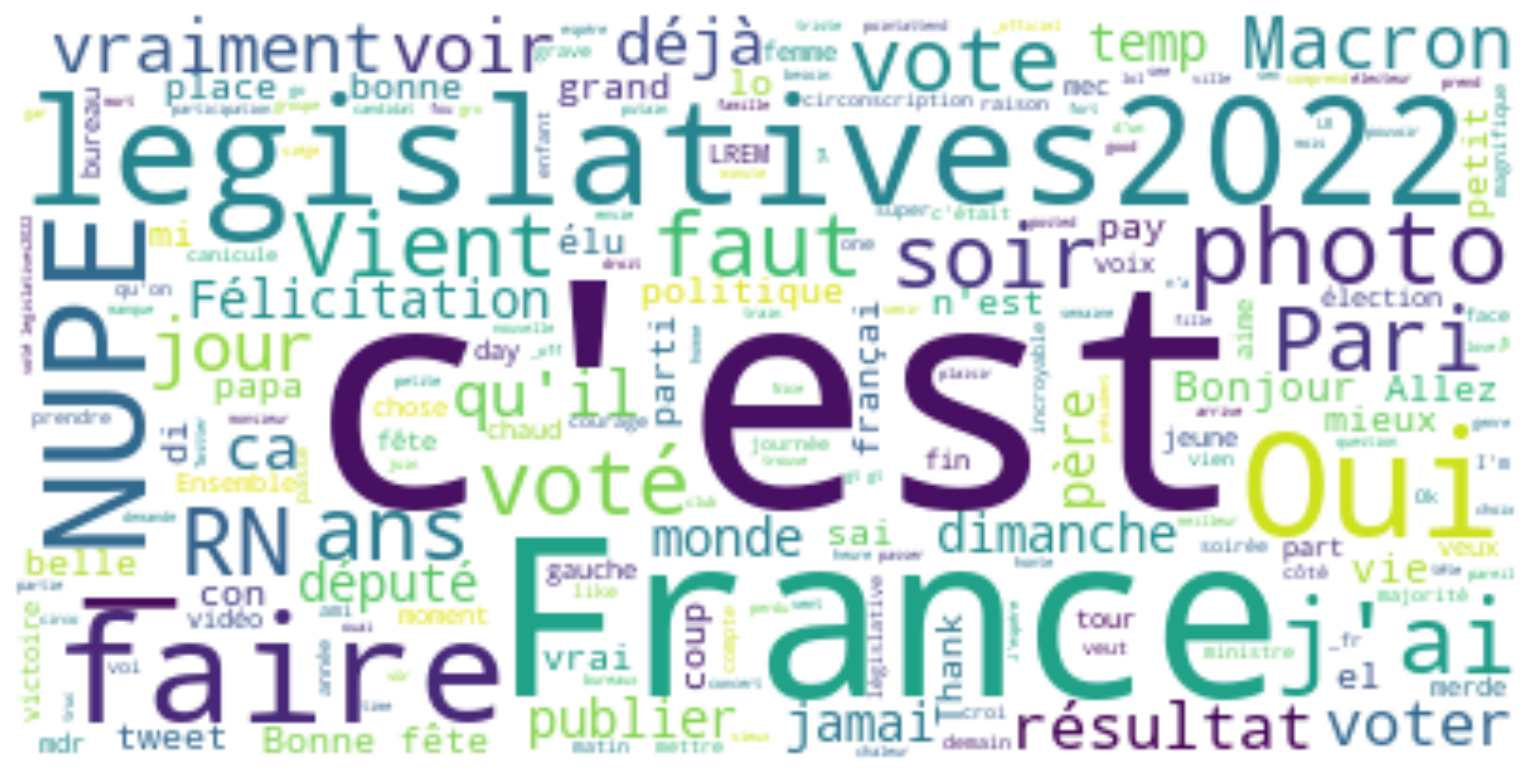
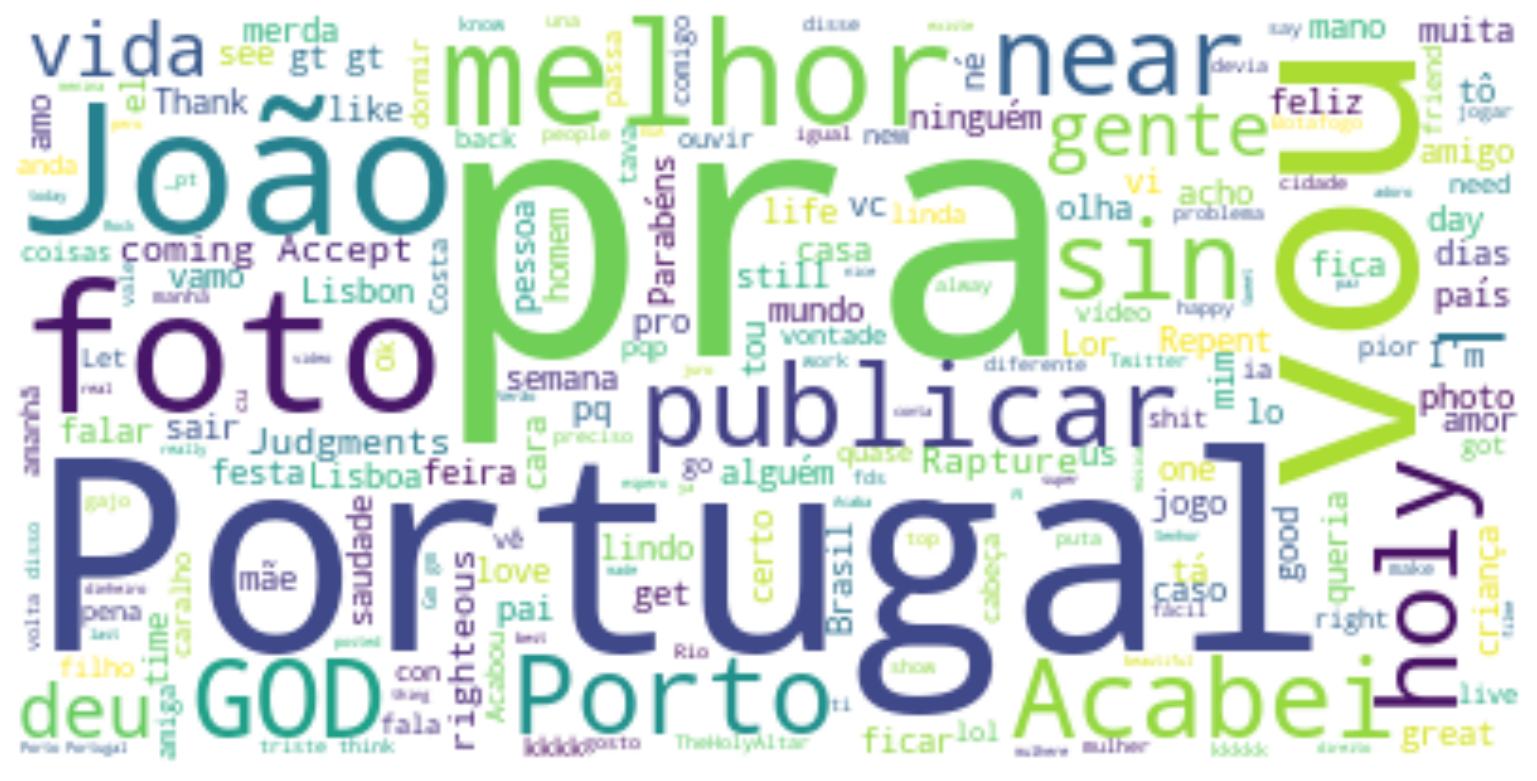
4.2 Word cloud and Word frequency⌗
Word cloud⌗
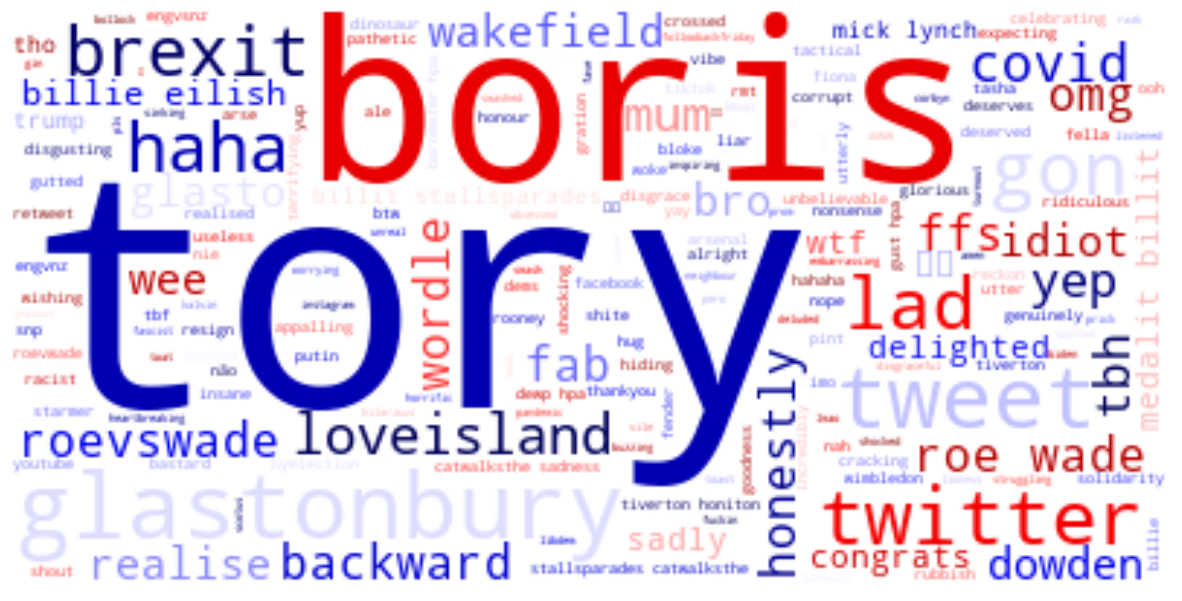
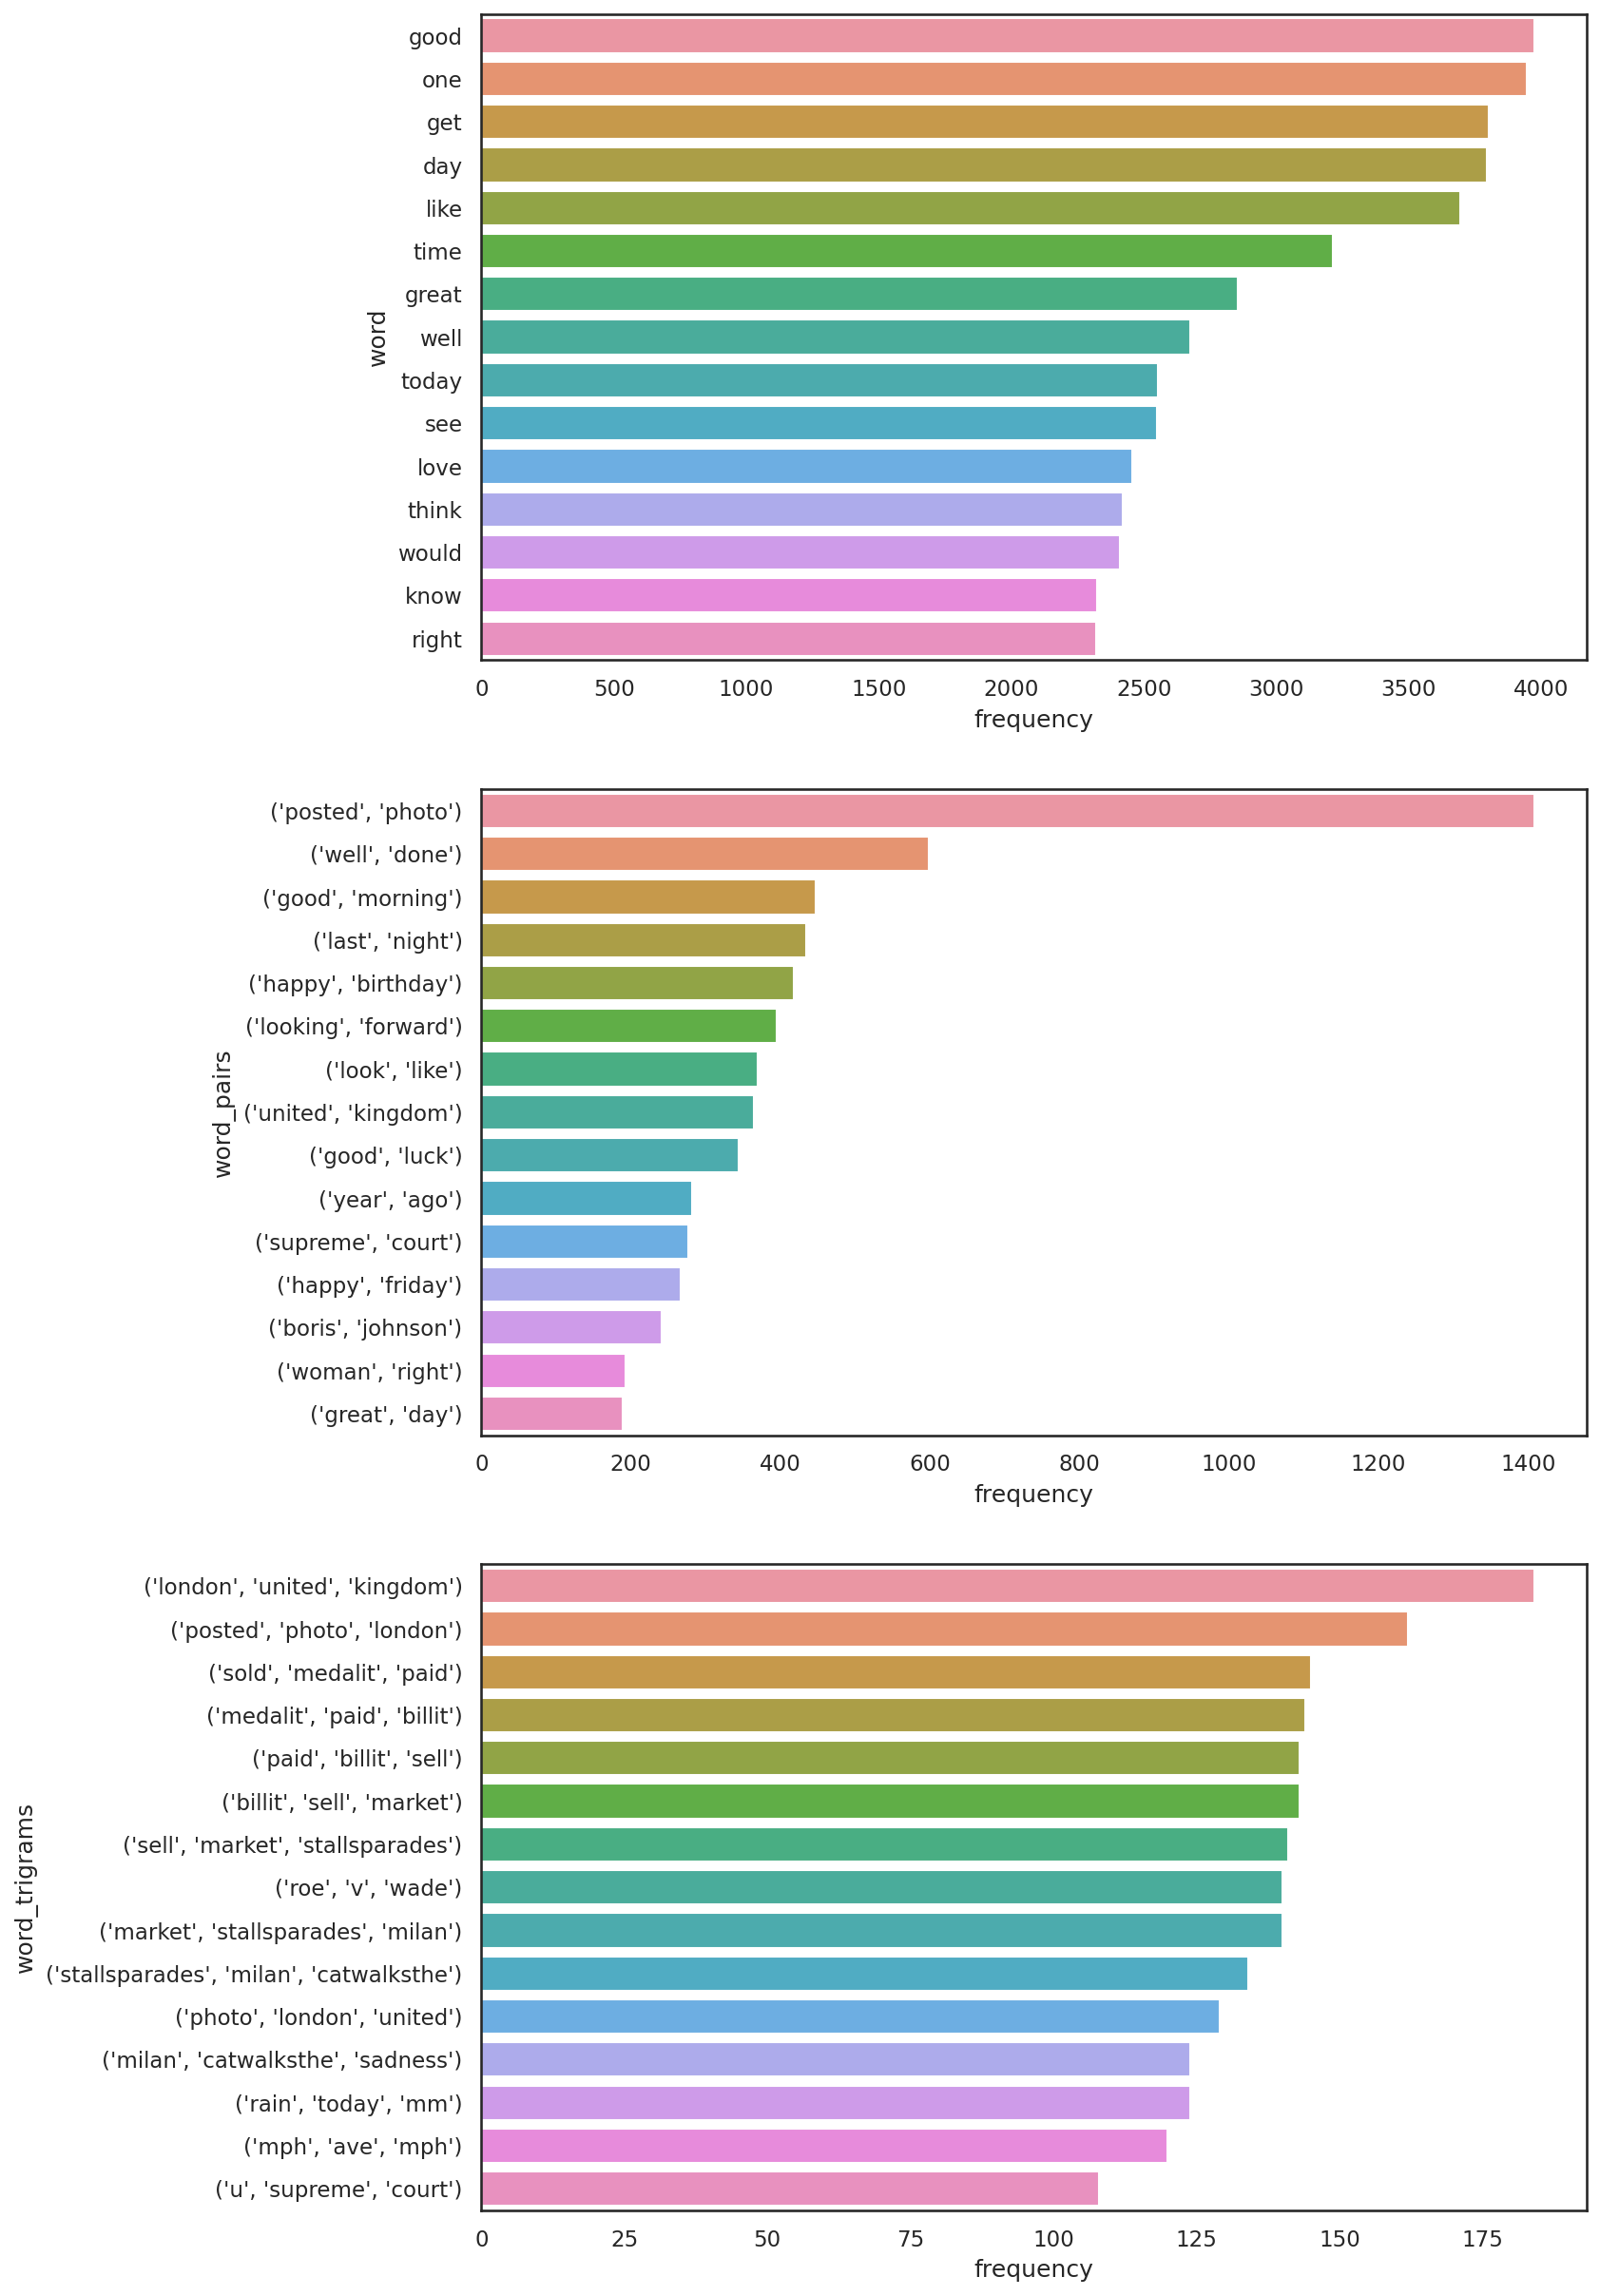
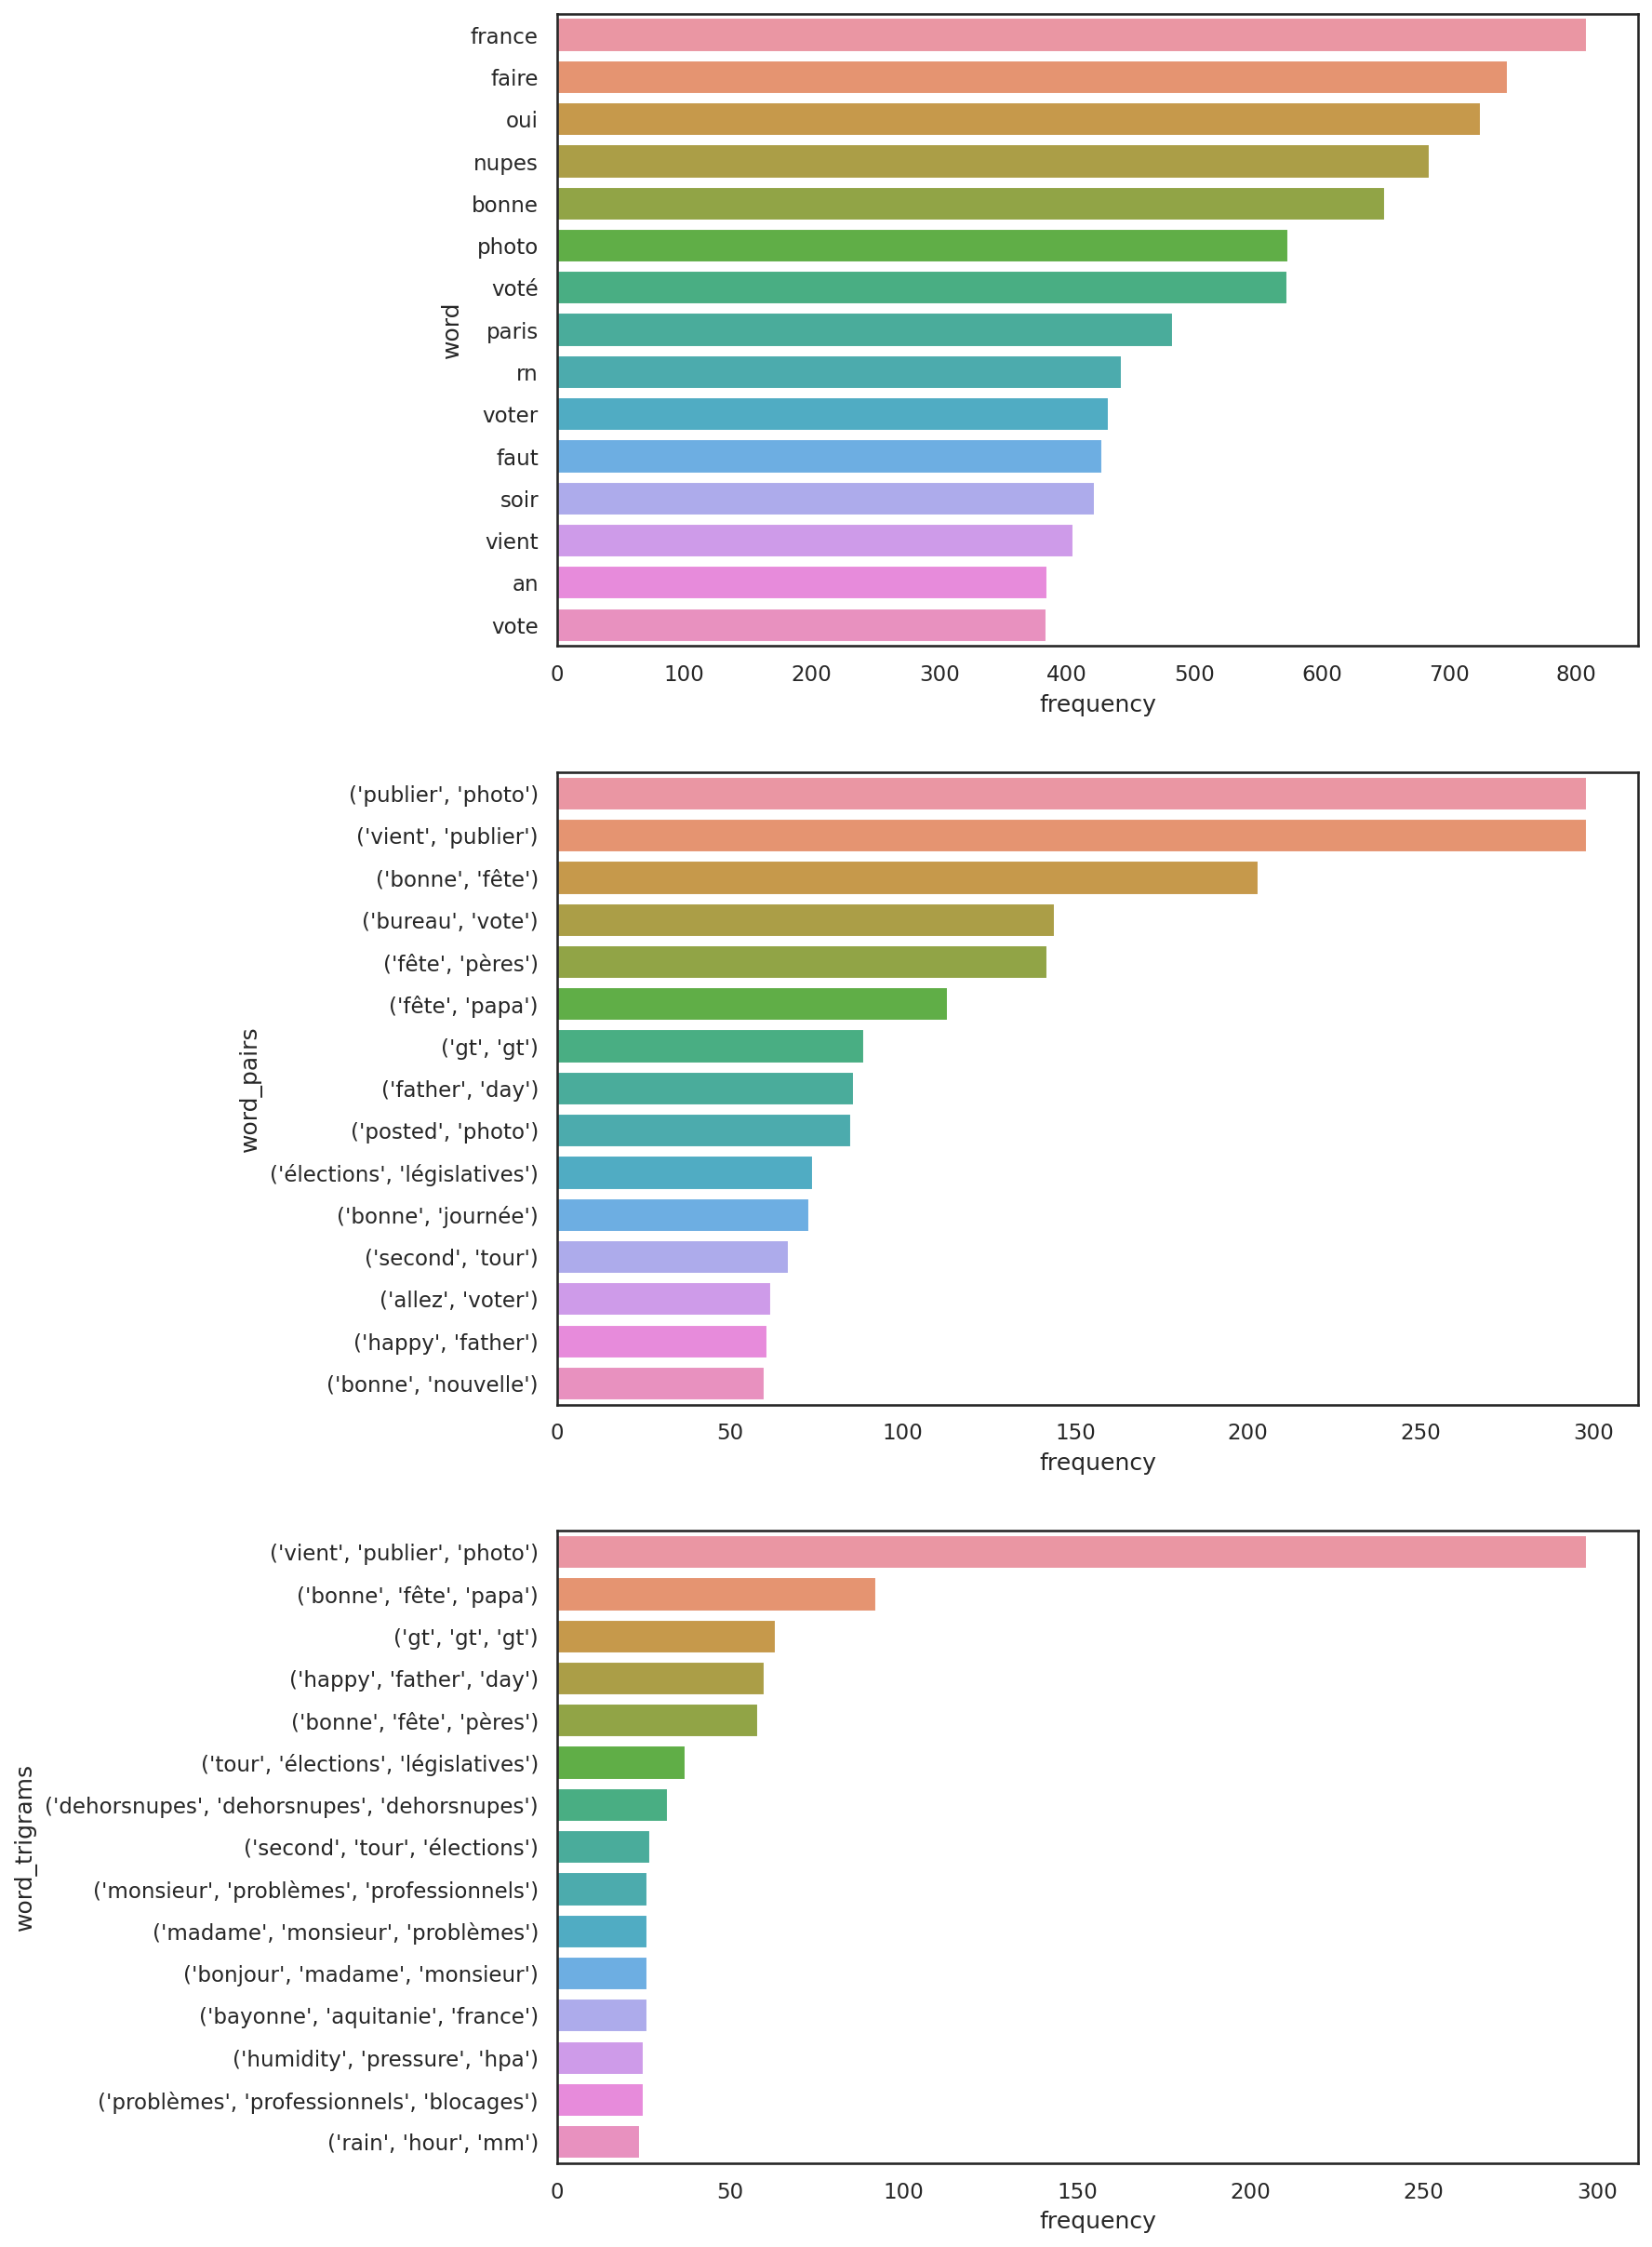
Word frequency⌗
4.3 Events detected⌗
The United Kingdom⌗
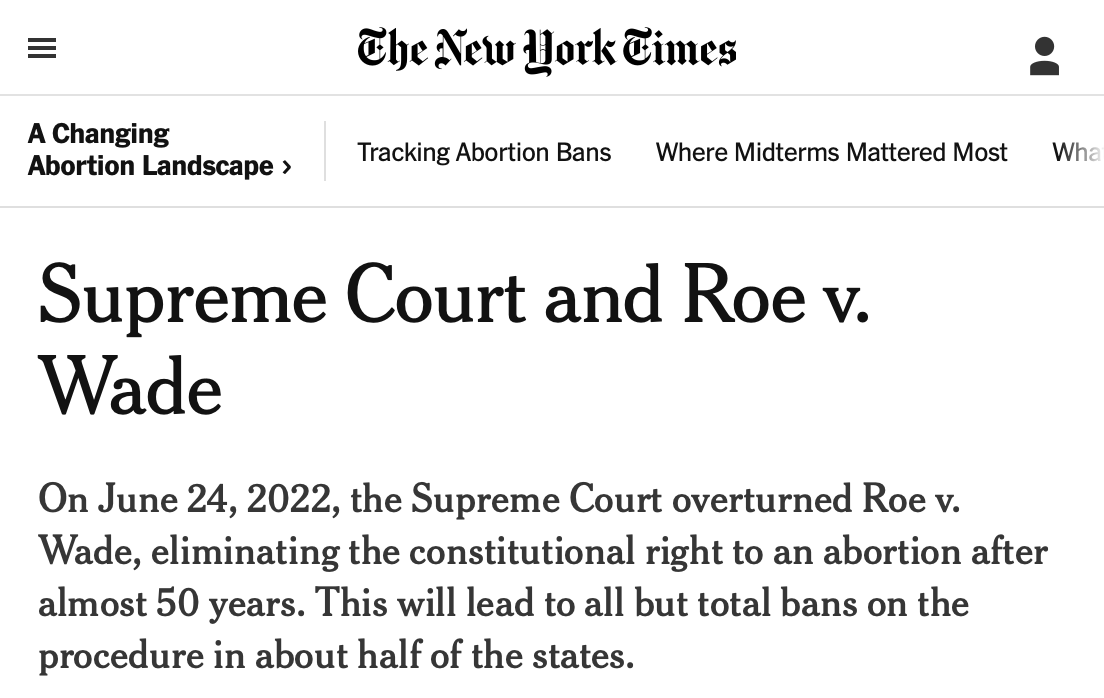
Figure 4.4 is the top 15 words frequency from the tweet texts in the UK on June 24. This figure shows some interesting word pairs like ('supreme','court'), ('woman','rights') and word trigrams like ('roe','v','wade'), ('u','supreme','court').
These words are reflecting the news on June 24 that the US Supreme Court overturned Roe v. Wade.3
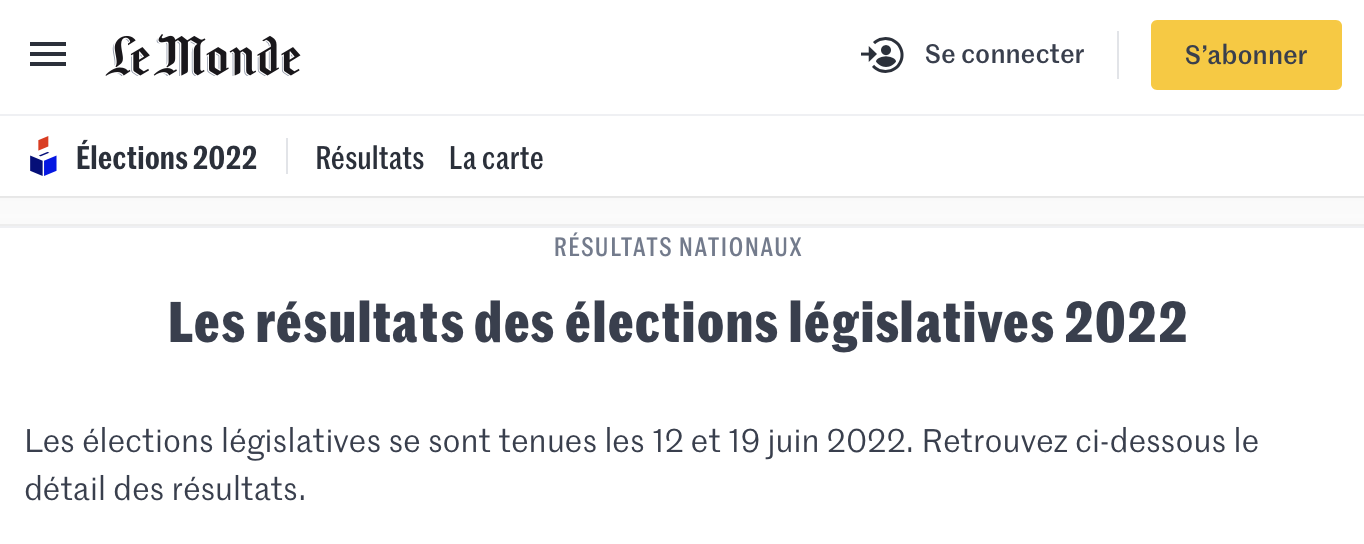
France⌗
Figure 4.5 is the top 15 words frequency from the tweet texts in France on June 19. This figure shows some interesting word pairs like ('bureau','vote'), ('élections','législatives'), ('second','tour') and word trigrams like ('tour','élections','législatives'), ('second', 'tour', 'élections").
These words are reflecting the second round of French Legislative elections on June 19.4
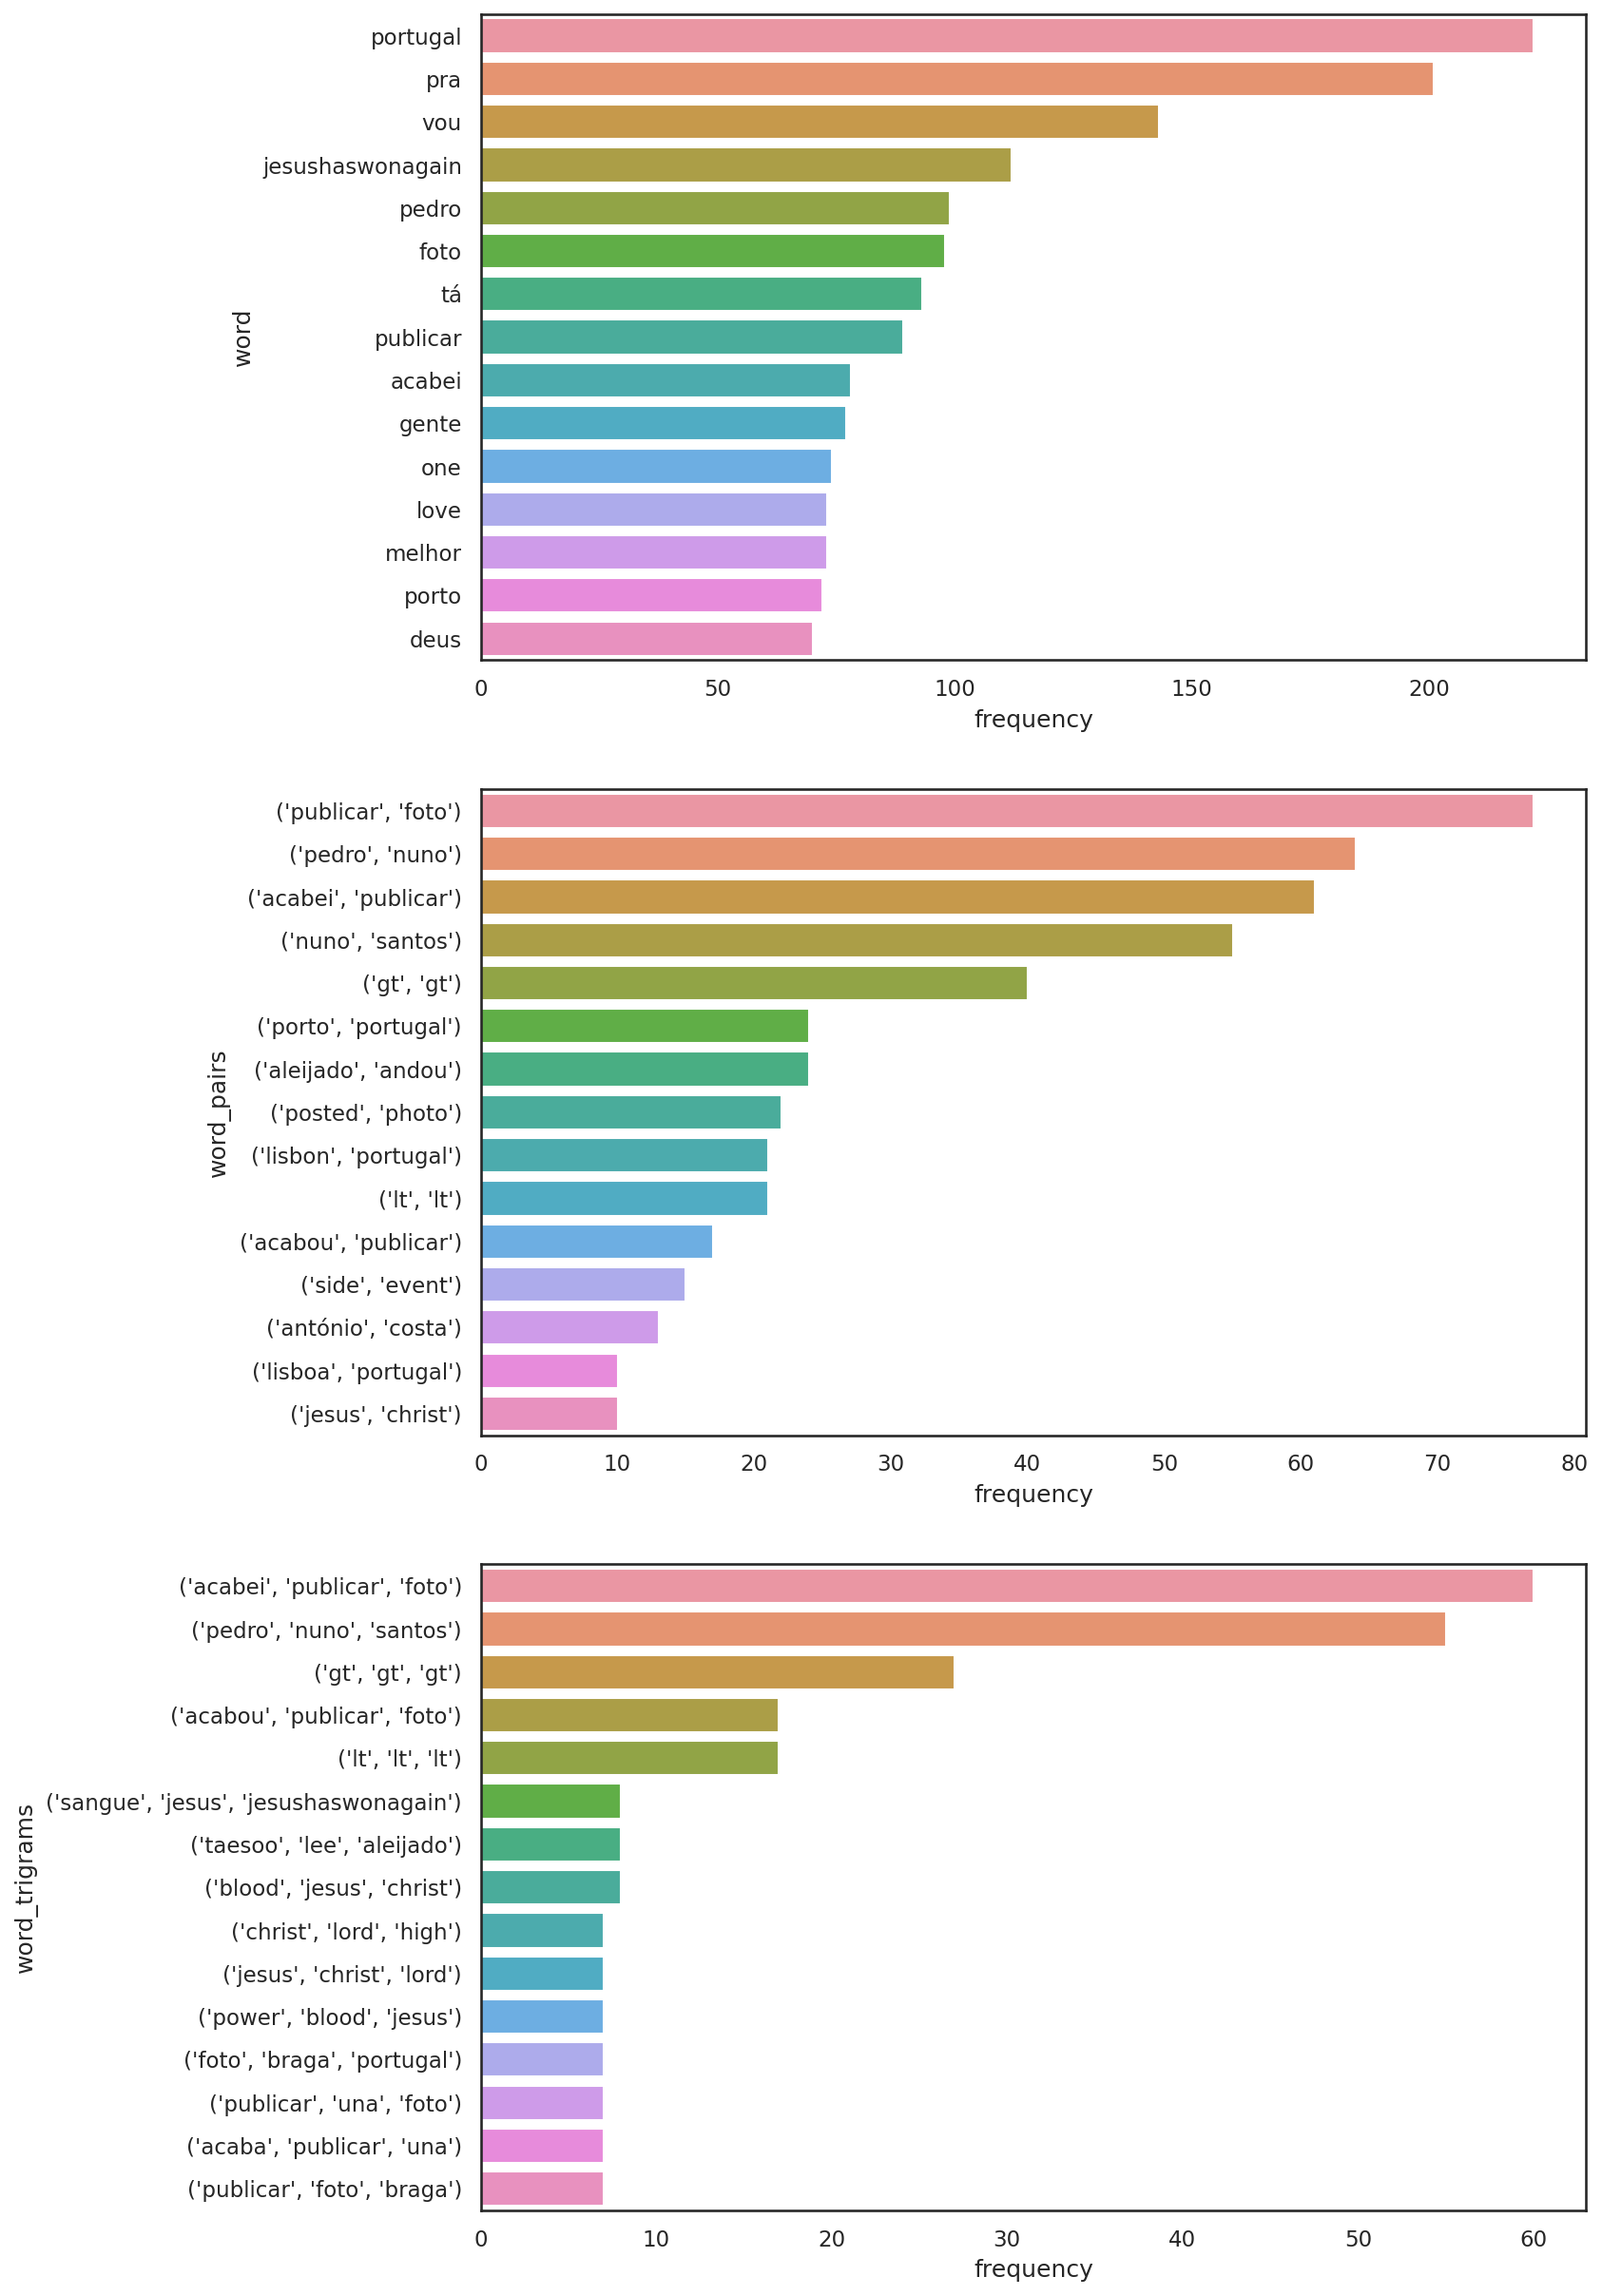
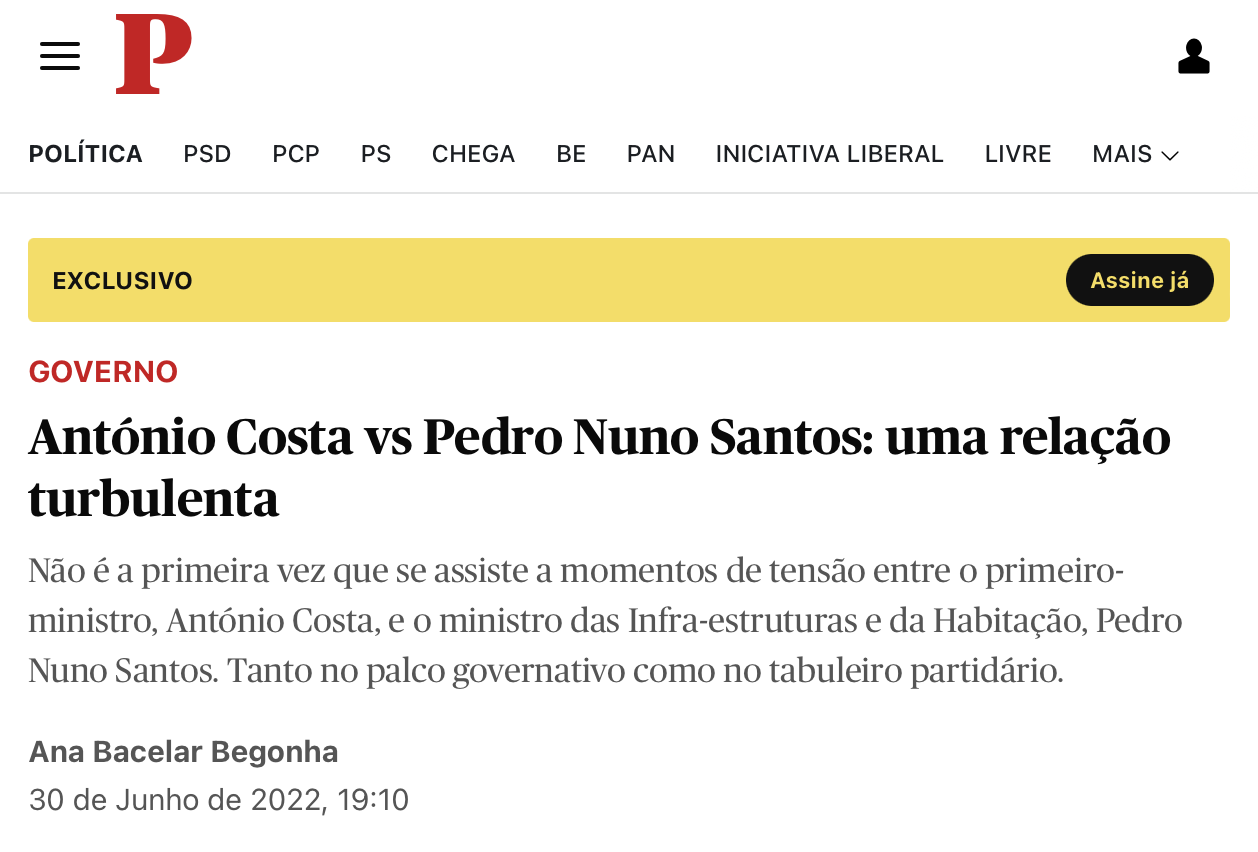
Portugal⌗
Figure 4.6 is the top 15 words frequency from the tweet texts in Portugal on June 24. This figure shows some interesting word pairs like ('pedro', 'nuno'), ('nuno', 'santos"), ('antónio', 'costa') and word trigrams like ('pedro', 'nuno', 'santos").
These words are reflecting the event that Portuguese Minister of Infrastructure Pedro Nuno Santos was unceremoniously sacked by Portuguese Prime Minister António Costa on June 30.5
5. Reflection⌗
From Twitter API, we can find there is a lot of metadata is recorded when a user publishes a tweet with the user’s permission. The Twitter dataset can provide a sufficient amount of information with semi-structured data which researchers and analysts could trace social trends, analysis public opinions, or profile a certain group.
But there are also drawbacks of the Twitter dataset.
1) Twitter users are biased
Users might be politically biased on social media stem of the social interactions of their accounts, a research found. Also, political biases on Twitter favor conservative content.6
2) Twitter representivity is skewed
Twitter users are not representative of a nation, Internet users, or even Twitter users themselves. According to a research from PEW Research Center, 80% of tweets come from the top 10% of most active users.7 Another PEW research shows that only 22% of American adults use Twitter.8
3) Bad actors or bots
Twitter is famous of full of non-human bots, as well as human-generated noise which could contaminate the data.
Like the previous finding in this report in “2.2 top five users”, the user c_antolic sent a lot of random german words, links, and pictures with no meaning, which is a huge noise in the dataset.
There is also human-generated noise that attempts to use trending hashtag to promote their ideas, political purposes, or commercials.
4) Ethical concerns
And there are also ethical concerns about using social datasets like Twitter one:
The most prolific case of social data set being misused is Facebook–Cambridge Analytica data scandal that is collected and used user data on Facebook without user consent. Though the data we obtained from Twitter API that user has accepted Twitter’s Terms of Service and User Agreement, more than 80% of users are not aware of these terms when they accepted them.9 Thus the research or analysis of Twitter data might cause damage or impact users without user’s informed consent which could be an ethical concern.
Reference⌗
Eurostat. (2022). Background - NUTS - NOMENCLATURE OF TERRITORIAL UNITS FOR STATISTICS. https://ec.europa.eu/eurostat/web/nuts/background. ↩︎
Eurostat. (2019). GISCO: GEOGRAPHICAL INFORMATION AND MAPS - LOCAL ADMINISTRATIVE UNITS (LAU). https://ec.europa.eu/eurostat/web/gisco/geodata/reference-data/administrative-units-statistical-units/lau#lau19. ↩︎
New York Times. (2022). Supreme Court and Roe v. Wade. https://www.nytimes.com/news-event/roe-v-wade-supreme-court-abortion. ↩︎
Le Monde. (2022). Les résultats des élections législatives 2022. https://www.lemonde.fr/resultats-elections/. ↩︎
La Política. (2022). António Costa vs Pedro Nuno Santos: uma relação turbulenta. https://www.publico.pt/2022/06/30/politica/noticia/antonio-costa-vs-pedro-nuno-santos-relacao-turbulenta-2012008. ↩︎
Indiana University. (2022). Political bias on social media emerges from users, not platform, IU study says. https://research.impact.iu.edu/key-areas/social-sciences/stories/social-media-platform-bias.html. ↩︎
PEW Research Center. (2019). Sizing Up Twitter Users. https://www.pewresearch.org/internet/2019/04/24/sizing-up-twitter-users/. ↩︎
PEW Research Center. (2019). Share of U.S. adults using social media, including Facebook, is mostly unchanged since 2018. https://www.pewresearch.org/fact-tank/2019/04/10/share-of-u-s-adults-using-social-media-including-facebook-is-mostly-unchanged-since-2018/. ↩︎
Deloitte. (2020). Changing attitudes to data privacy - Digital Consumer Trends 2020. https://www2.deloitte.com/uk/en/pages/technology-media-and-telecommunications/articles/digital-consumer-trends-data-privacy.html. ↩︎